

Question: 2021 2022 2023 2024 2025 2026 Income Statement Finished Goods Expense Depreciation Labor Overhead EBIT Interest Income (5% interest rate) Pretax Tax (30%tax rate) Net
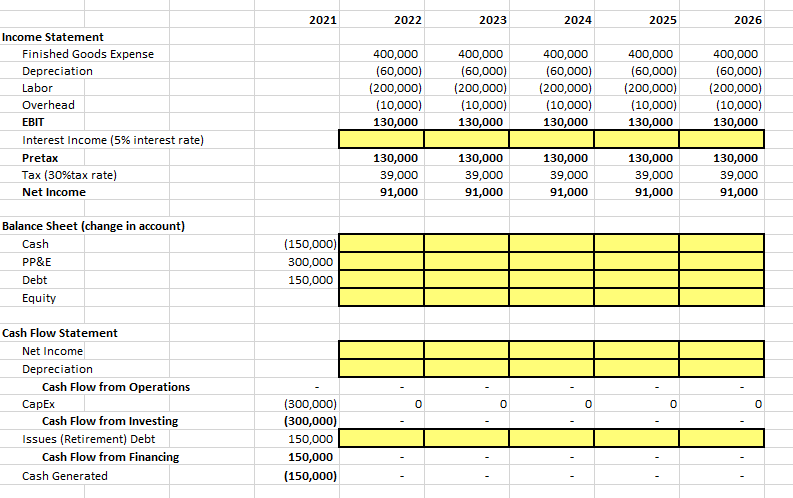
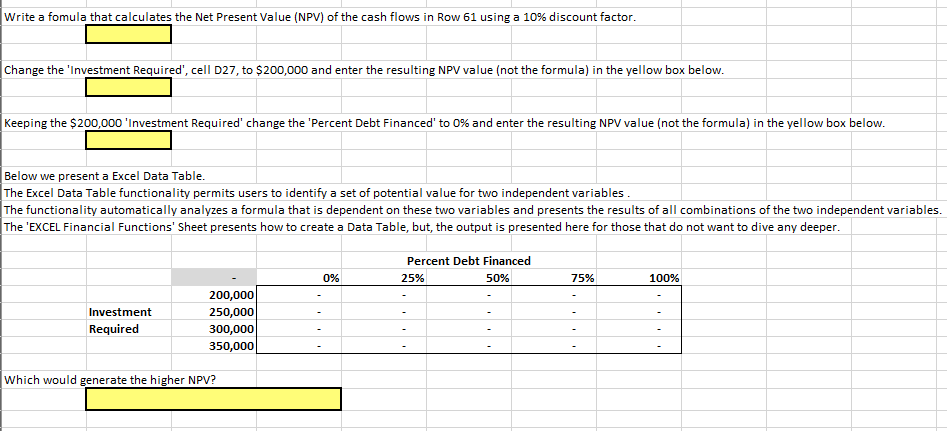
2021 2022 2023 2024 2025 2026 Income Statement Finished Goods Expense Depreciation Labor Overhead EBIT Interest Income (5% interest rate) Pretax Tax (30%tax rate) Net Income 400,000 (60,000) (200,000) (10,000) 130,000 400,000 (60,000) (200,000) (10,000) 130,000 400,000 (60,000) (200,000) (10,000) 130,000 400,000 (60,000) (200,000) (10,000) 130,000 400,000 (60,000) (200,000) (10,000) 130,000 130,000 39,000 91,000 130,000 39,000 91,000 130,000 39,000 91,000 130,000 39,000 91,000 130,000 39,000 91,000 Balance Sheet (change in account) Cash PP&E (150,000) 300,000 150,000 Debt Equity Cash Flow Statement Net Income Depreciation Cash Flow from Operations Capex Cash Flow from Investing Issues (Retirement) Debt Cash Flow from Financing Cash Generated 0 0 0 0 0 (300,000) (300,000) 150,000 150,000 (150,000) Write a fomula that calculates the Net Present Value (NPV) of the cash flows in Row 61 using a 10% discount factor. Change the 'Investment Required', cell D27, to $200,000 and enter the resulting NPV value (not the formula) in the yellow box below. Keeping the $200,000 'Investment Required' change the 'Percent Debt Financed' to 0% and enter the resulting NPV value (not the formula) in the yellow box below. Below we present a Excel Data Table. The Excel Data Table functionality permits users to identify a set of potential value for two independent variables. The functionality automatically analyzes a formula that is dependent on these two variables and presents the results of all combinations of the two independent variables. The 'EXCEL Financial Functions' Sheet presents how to create a Data Table, but the output is presented here for those that do not want to dive any deeper. Percent Debt Financed 25% 50% 0% 75% 100% Investment Required 200,000 250,000 300,000 350,000 Which would generate the higher NPV? 2021 2022 2023 2024 2025 2026 Income Statement Finished Goods Expense Depreciation Labor Overhead EBIT Interest Income (5% interest rate) Pretax Tax (30%tax rate) Net Income 400,000 (60,000) (200,000) (10,000) 130,000 400,000 (60,000) (200,000) (10,000) 130,000 400,000 (60,000) (200,000) (10,000) 130,000 400,000 (60,000) (200,000) (10,000) 130,000 400,000 (60,000) (200,000) (10,000) 130,000 130,000 39,000 91,000 130,000 39,000 91,000 130,000 39,000 91,000 130,000 39,000 91,000 130,000 39,000 91,000 Balance Sheet (change in account) Cash PP&E (150,000) 300,000 150,000 Debt Equity Cash Flow Statement Net Income Depreciation Cash Flow from Operations Capex Cash Flow from Investing Issues (Retirement) Debt Cash Flow from Financing Cash Generated 0 0 0 0 0 (300,000) (300,000) 150,000 150,000 (150,000) Write a fomula that calculates the Net Present Value (NPV) of the cash flows in Row 61 using a 10% discount factor. Change the 'Investment Required', cell D27, to $200,000 and enter the resulting NPV value (not the formula) in the yellow box below. Keeping the $200,000 'Investment Required' change the 'Percent Debt Financed' to 0% and enter the resulting NPV value (not the formula) in the yellow box below. Below we present a Excel Data Table. The Excel Data Table functionality permits users to identify a set of potential value for two independent variables. The functionality automatically analyzes a formula that is dependent on these two variables and presents the results of all combinations of the two independent variables. The 'EXCEL Financial Functions' Sheet presents how to create a Data Table, but the output is presented here for those that do not want to dive any deeper. Percent Debt Financed 25% 50% 0% 75% 100% Investment Required 200,000 250,000 300,000 350,000 Which would generate the higher NPV
Step by Step Solution
There are 3 Steps involved in it

Get step-by-step solutions from verified subject matter experts