

Question: 21 21. The scarter plot below shows the relationship between the number of bags of popcorn that are sold and the price per bag POPCORN
21
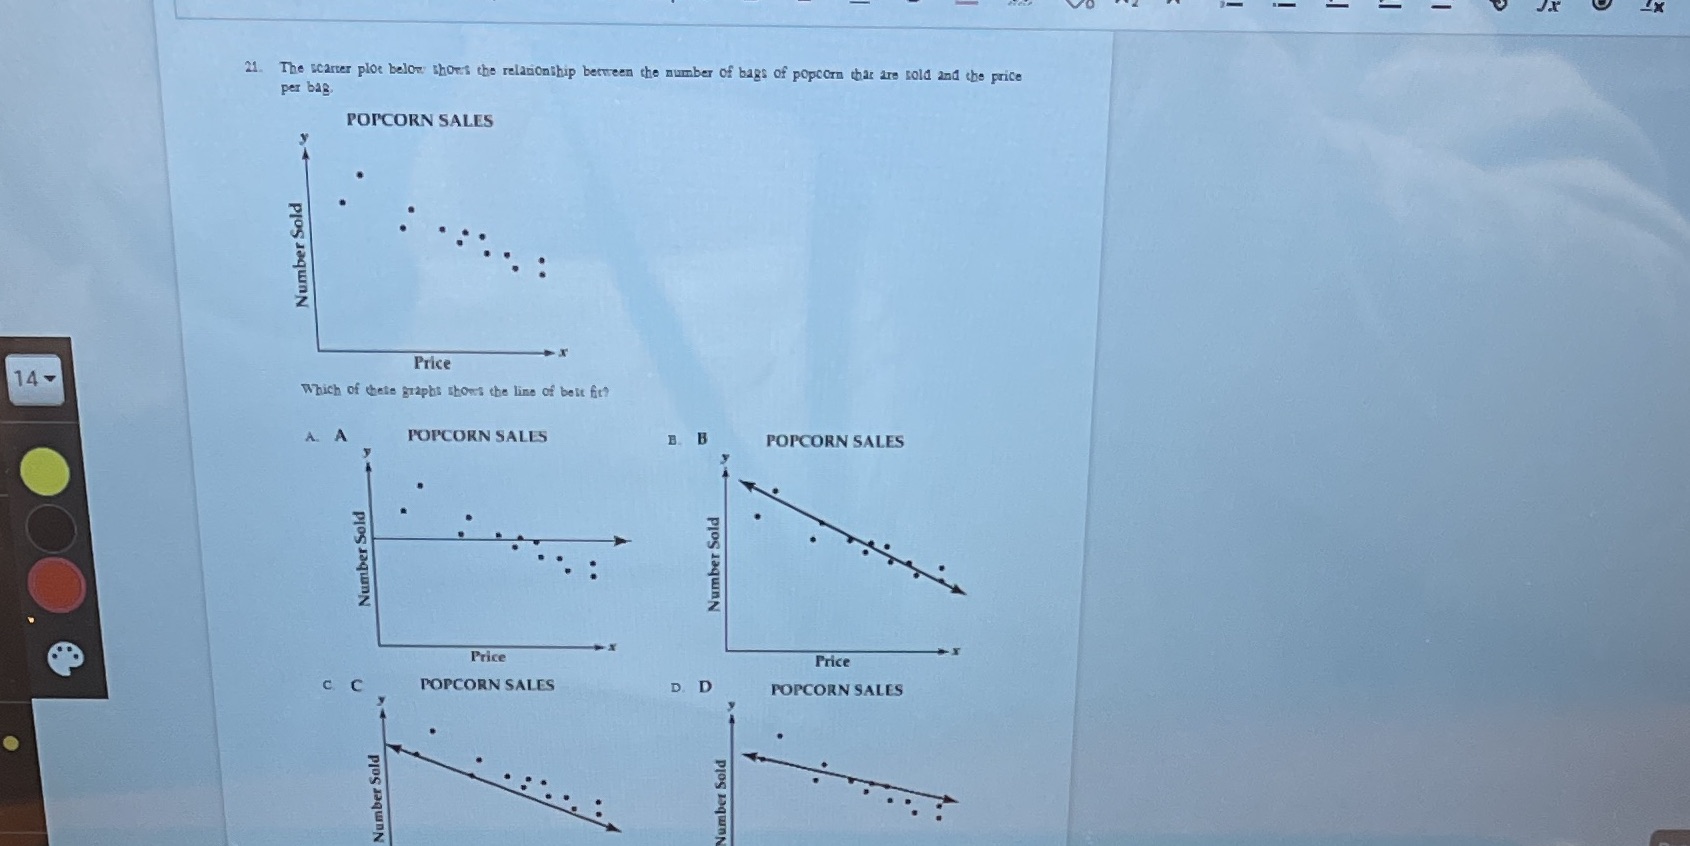
21. The scarter plot below shows the relationship between the number of bags of popcorn that are sold and the price per bag POPCORN SALES Number Sold Price 14 - Which of thete graphs shows the line of best fit? A. POPCORN SALES B POPCORN SALES Number Sold Number Sold Price Price C C POPCORN SALES D. D POPCORN SALES Number Sold lumber Sold
Step by Step Solution
There are 3 Steps involved in it
1 Expert Approved Answer
Step: 1 Unlock

Question Has Been Solved by an Expert!
Get step-by-step solutions from verified subject matter experts
Step: 2 Unlock
Step: 3 Unlock