

Question: 2.1 (chickwts data). The chickwts data are collected from an experiment to compare the effectiveness of various feed supplements on the growth rate of chickens
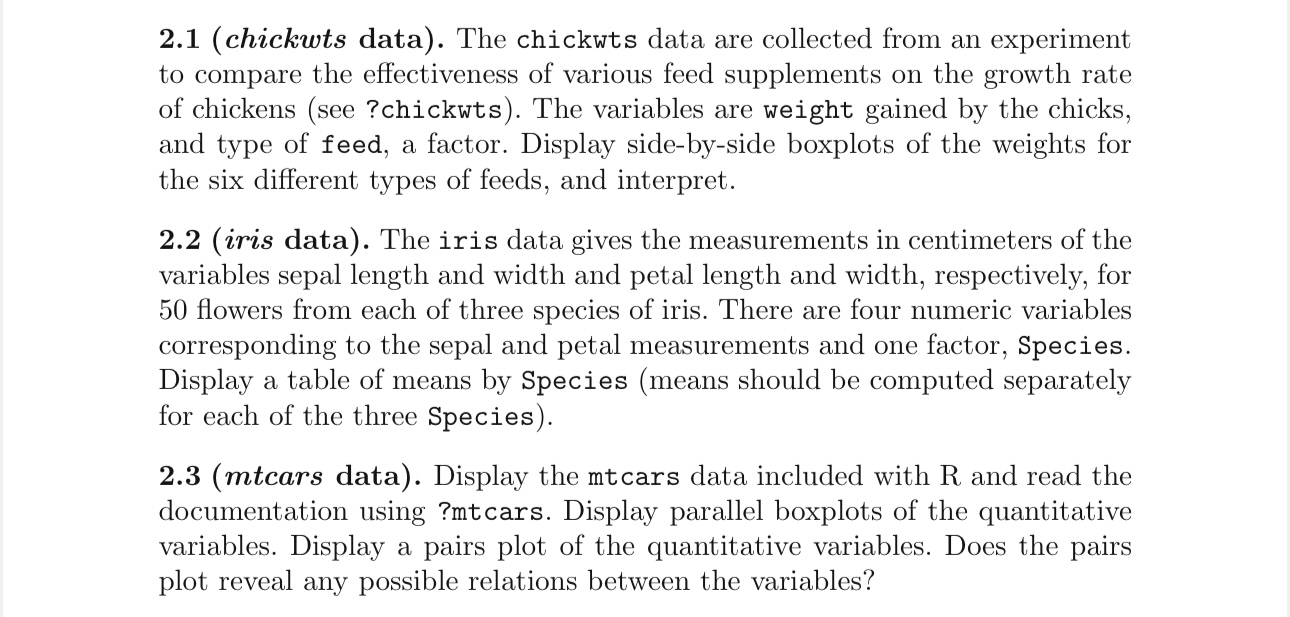
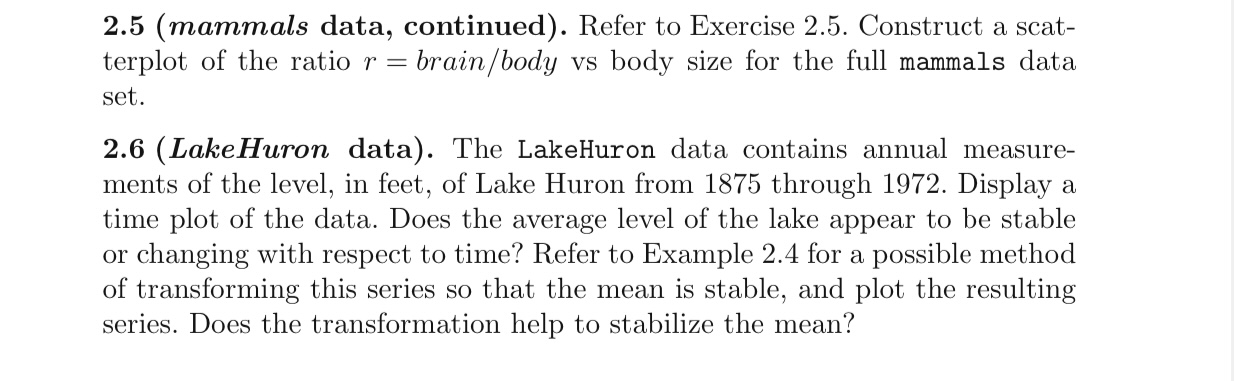
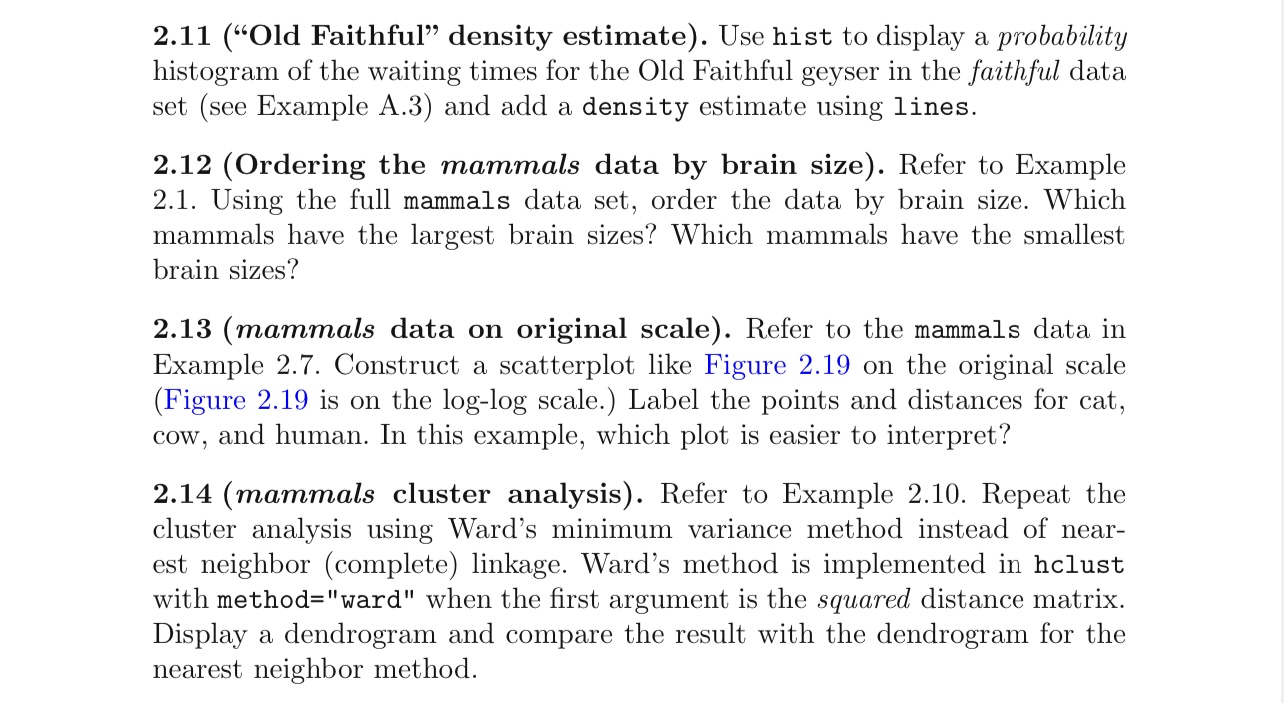
2.1 (chickwts data). The chickwts data are collected from an experiment to compare the effectiveness of various feed supplements on the growth rate of chickens (see 7chickwts). The variables are weight gained by the chicks, and type of feed, a factor. Display side-by-side boxplots of the weights for the six different types of feeds, and interpret. 2.2 (4ris data). The iris data gives the measurements in centimeters of the variables sepal length and width and petal length and width, respectively, for 50 flowers from each of three species of iris. There are four numeric variables corresponding to the sepal and petal measurements and one factor, Species. Display a table of means by Species (means should be computed separately for each of the three Species). 2.3 (mtcars data). Display the mtcars data included with R and read the documentation using ?mtcars. Display parallel boxplots of the quantitative variables. Display a pairs plot of the quantitative variables. Does the pairs plot reveal any possible relations between the variables? 2.5 (mammals data, continued). Refer to Exercise 2.5. Construct a scat- terplot of the ratio r = brain/body vs body size for the full mammals data set. 2.6 (LakeHuron data). The LakeHuron data contains annual measure- ments of the level, in feet, of Lake Huron from 1875 through 1972. Display a time plot of the data. Does the average level of the lake appear to be stable or changing with respect to time? Refer to Example 2.4 for a possible method of transforming this series so that the mean is stable, and plot the resulting series. Does the transformation help to stabilize the mean? 2.11 (\"Old Faithful\" density estimate). Use hist to display a probability histogram of the waiting times for the Old Faithful geyser in the faithful data set (see Example A.3) and add a density estimate using lines. 2.12 (Ordering the mammals data by brain size). Refer to Example 2.1. Using the full mammals data set, order the data by brain size. Which mammals have the largest brain sizes? Which mammals have the smallest brain sizes? 2.13 (mammals data on original scale). Refer to the mammals data in Example 2.7. Construct a scatterplot like Figure 2.19 on the original scale (Figure 2.19 is on the log-log scale.) Label the points and distances for cat, cow, and human. In this example, which plot is easier to interpret? 2.14 (mammals cluster analysis). Refer to Example 2.10. Repeat the cluster analysis using Ward's minimum variance method instead of near- est neighbor (complete) linkage. Ward's method is implemented in hclust with method="ward" when the first argument is the squared distance matrix. Display a dendrogram and compare the result with the dendrogram for the nearest neighbor method
Step by Step Solution
There are 3 Steps involved in it

Get step-by-step solutions from verified subject matter experts