

Question: 2.1 Create a function to generate periodic signals The goal of this section is to write a function to generate a periodic signal using the
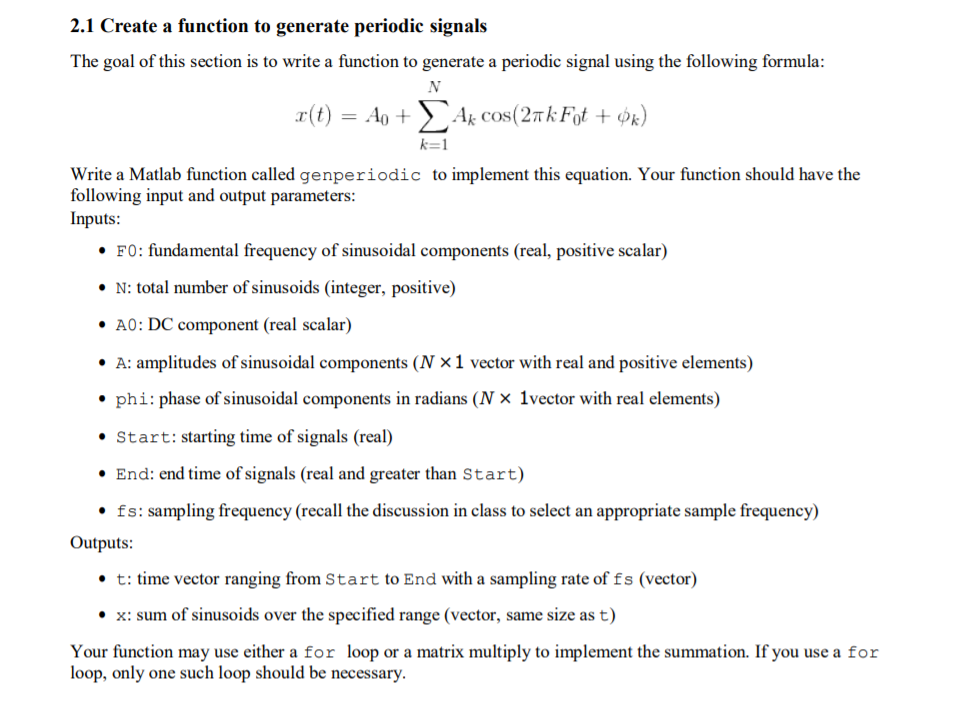
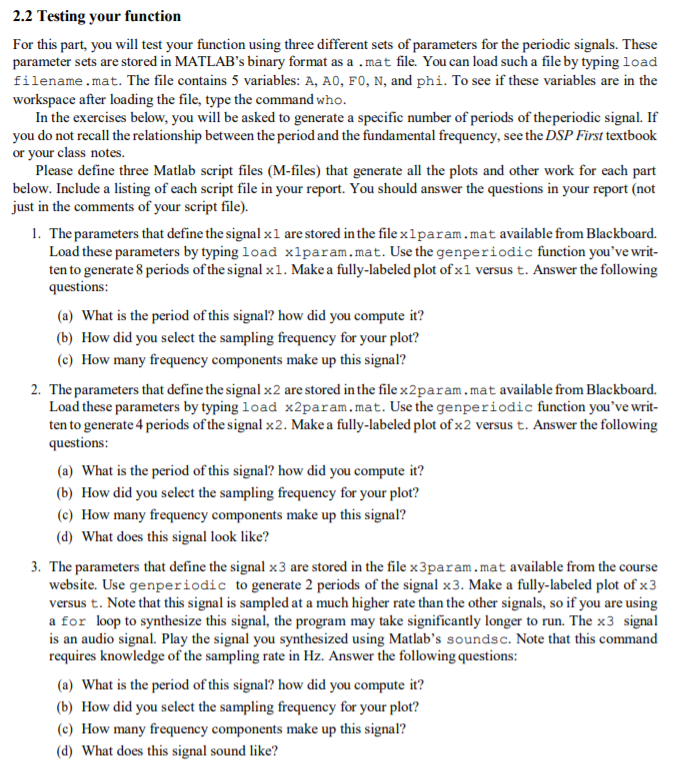
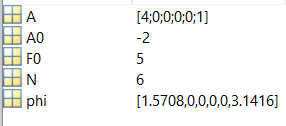
2.1 Create a function to generate periodic signals The goal of this section is to write a function to generate a periodic signal using the following formula: N r(t) = 40 + Ak cos(2k Fot + k) k=1 Write a Matlab function called genperiodic to implement this equation. Your function should have the following input and output parameters: Inputs: FO: fundamental frequency of sinusoidal components (real, positive scalar) N: total number of sinusoids (integer, positive) AO: DC component (real scalar) A: amplitudes of sinusoidal components (N X1 vector with real and positive elements) phi: phase of sinusoidal components in radians (N * 1vector with real elements) Start: starting time of signals (real) End: end time of signals (real and greater than Start) fs: sampling frequency (recall the discussion in class to select an appropriate sample frequency) Outputs: t: time vector ranging from Start to End with a sampling rate of fs (vector) x: sum of sinusoids over the specified range (vector, same size as t) Your function may use either a for loop or a matrix multiply to implement the summation. If you use a for loop, only one such loop should be necessary. 2.2 Testing your function For this part, you will test your function using three different sets of parameters for the periodic signals. These parameter sets are stored in MATLAB's binary format as a .mat file. You can load such a file by typing load filename.mat. The file contains 5 variables: A, AO, FO, N, and phi. To see if these variables are in the workspace after loading the file, type the command who. In the exercises below, you will be asked to generate a specific number of periods of the periodic signal. If you do not recall the relationship between the period and the fundamental frequency, see the DSP First textbook or your class notes. Please define three Matlab script files (M-files) that generate all the plots and other work for each part below. Include a listing of each script file in your report. You should answer the questions in your report (not just in the comments of your script file). 1. The parameters that define the signal xl are stored in the file xlparam.mat available from Blackboard. Load these parameters by typing load xlparam.mat. Use the genperiodic function you've writ- ten to generate 8 periods of the signal x1. Make a fully-labeled plot of xl versus t. Answer the following questions: (a) What is the period of this signal? how did you compute it? (b) How did you select the sampling frequency for your plot? (e) How many frequency components make up this signal? 2. The parameters that define the signal x 2 are stored in the file x2 param.mat available from Blackboard. Load these parameters by typing load x2param.mat. Use the genperiodic function you've writ- ten to generate 4 periods of the signal x2. Make a fully-labeled plot of x2 versus t. Answer the following questions: (a) What is the period of this signal? how did you compute it? (b) How did you select the sampling frequency for your plot? (c) How many frequency components make up this signal? (d) What does this signal look like? 3. The parameters that define the signal x 3 are stored in the file x 3param.mat available from the course website. Use genperiodic to generate 2 periods of the signal x3. Make a fully-labeled plot of x3 versus t. Note that this signal is sampled at a much higher rate than the other signals, so if you are using a for loop to synthesize this signal, the program may take significantly longer to run. The x3 signal is an audio signal. Play the signal you synthesized using Matlab's soundsc. Note that this command requires knowledge of the sampling rate in Hz. Answer the following questions: (a) What is the period of this signal? how did you compute it? (b) How did you select the sampling frequency for your plot? (c) How many frequency components make up this signal? (d) What does this signal sound like? [43050505031] [1.5708,0,0,0,0,3.1416]
Step by Step Solution
There are 3 Steps involved in it

Get step-by-step solutions from verified subject matter experts