

Question: 21. Expand Your Knowledge: Decimal Data The following data represent tonnes of wheat harvested each year (1894-1925) from Plot 19 at the Rothamsted Agricultural Experiment
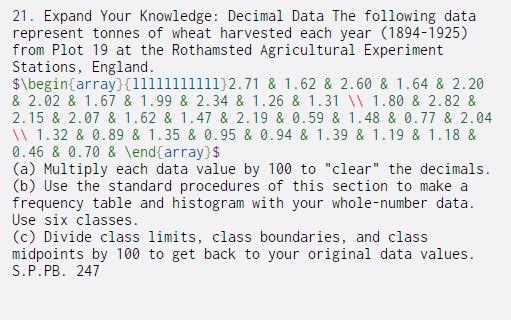
21. Expand Your Knowledge: Decimal Data The following data represent tonnes of wheat harvested each year (1894-1925) from Plot 19 at the Rothamsted Agricultural Experiment Stations, England. $\begin{array}{111 11}2.71 & 1.62 & 2.60 & 1.64 & 2.20 & 2.02 & 1.67 & 1.99 & 2.34 & 1.26 & 1.31 1.80 & 2.82 & 2.15 & 2.07 & 1.62 & 1.47 & 2.19 & 0.59 & 1.48 & 0.77 & 2.04 \\1.32 & 0.89 & 1.35 & 0.95 & 0.94 & 1.39 & 1.19 & 1.18 & 0.46 & 0.70 & \end{array} $ (a) Multiply each data value by 100 to "clear" the decimals. (b) Use the standard procedures of this section to make a frequency table and histogram with your whole-number data. Use six classes. (c) Divide class limits, class boundaries, and class midpoints by 100 to get back to your original data values. S.P.PB. 247
Step by Step Solution
There are 3 Steps involved in it

Get step-by-step solutions from verified subject matter experts