

Question: 2.1 Graph for flat plate 3.5 3.0 2.5 2.0 1.5 1.0 force(N) 0.5 0.0 0.00 -Fj (N) Plate -Fp (N) Plate -sushil's data Fj
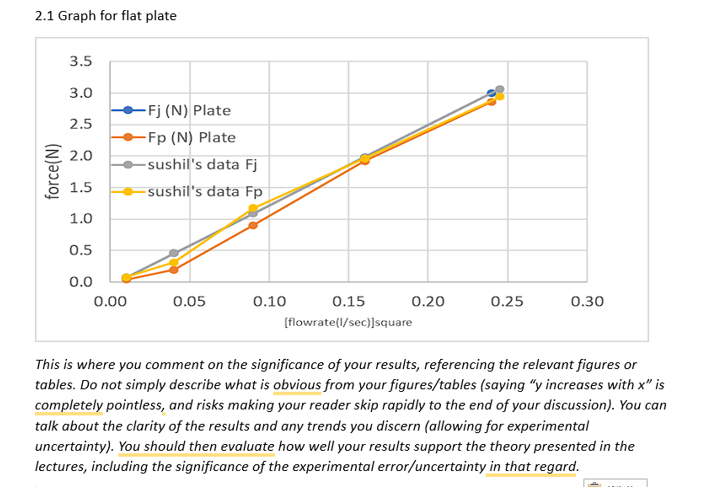
2.1 Graph for flat plate 3.5 3.0 2.5 2.0 1.5 1.0 force(N) 0.5 0.0 0.00 -Fj (N) Plate -Fp (N) Plate -sushil's data Fj -sushil's data Fp 0.05 0.15 [flowrate(l/sec)]square 0.10 0.20 0.25 0.30 This is where you comment on the significance of your results, referencing the relevant figures or tables. Do not simply describe what is obvious from your figures/tables (saying "y increases with x" is completely pointless, and risks making your reader skip rapidly to the end of your discussion). You can talk about the clarity of the results and any trends you discern (allowing for experimental uncertainty). You should then evaluate how well your results support the theory presented in the lectures, including the significance of the experimental error/uncertainty in that regard.
Step by Step Solution
There are 3 Steps involved in it
Based on the provided graph we can observe the relationship between the force exerted on a flat plat... View full answer

Get step-by-step solutions from verified subject matter experts