

21. Ten different families are tested for the number of litres of waver a week they use...
Fantastic news! We've Found the answer you've been seeking!
Question:
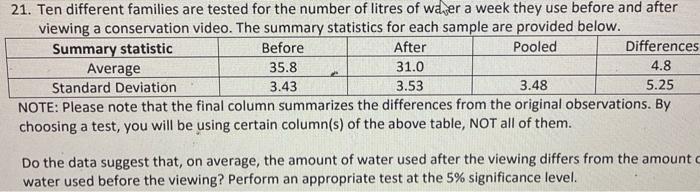
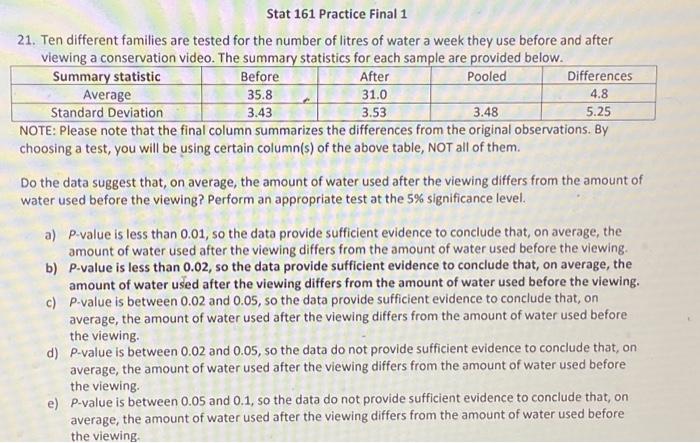
21. Ten different families are tested for the number of litres of waver a week they use before and after viewing a conservation video. The summary statistics for each sample are provided below. Summary statistic Before Pooled Average 35.8 3.43 After 31.0 Differences 4.8 5.25 Standard Deviation 3.53 3.48 NOTE: Please note that the final column summarizes the differences from the original observations. By choosing a test, you will be using certain column(s) of the above table, NOT all of them. Do the data suggest that, on average, the amount of water used after the viewing differs from the amount c water used before the viewing? Perform an appropriate test at the 5% significance level.
Expert Answer:

Posted Date:
