Question: 2.1.3 Question Help 0 The table to the right represents the annual percentage of smartphones sold in a certain region in 2011, 2012, and 2013
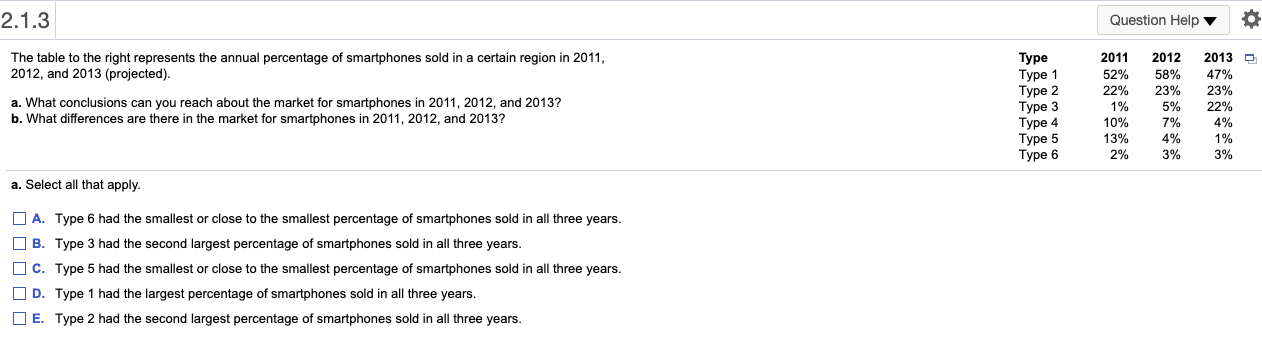
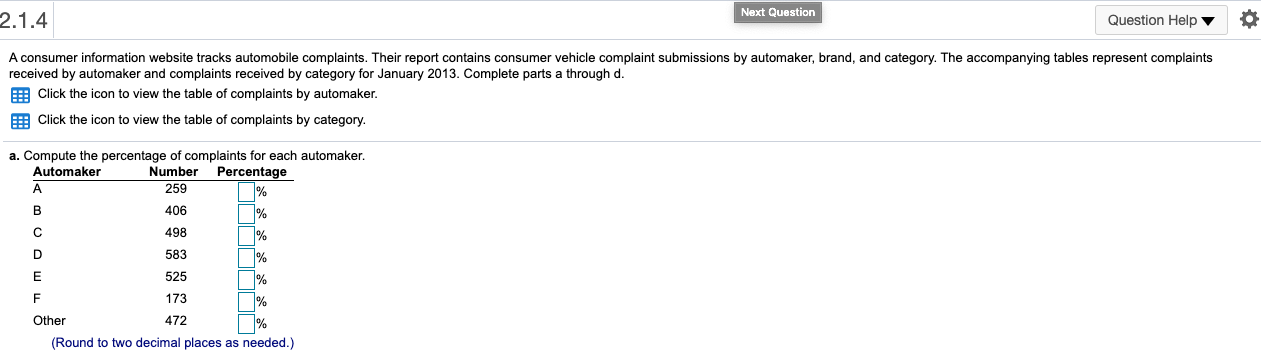
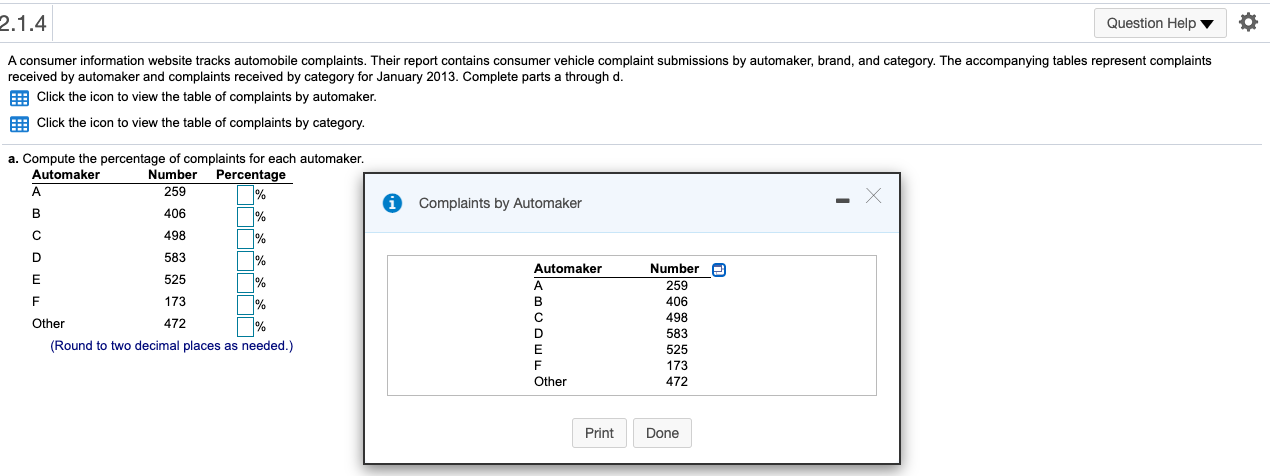
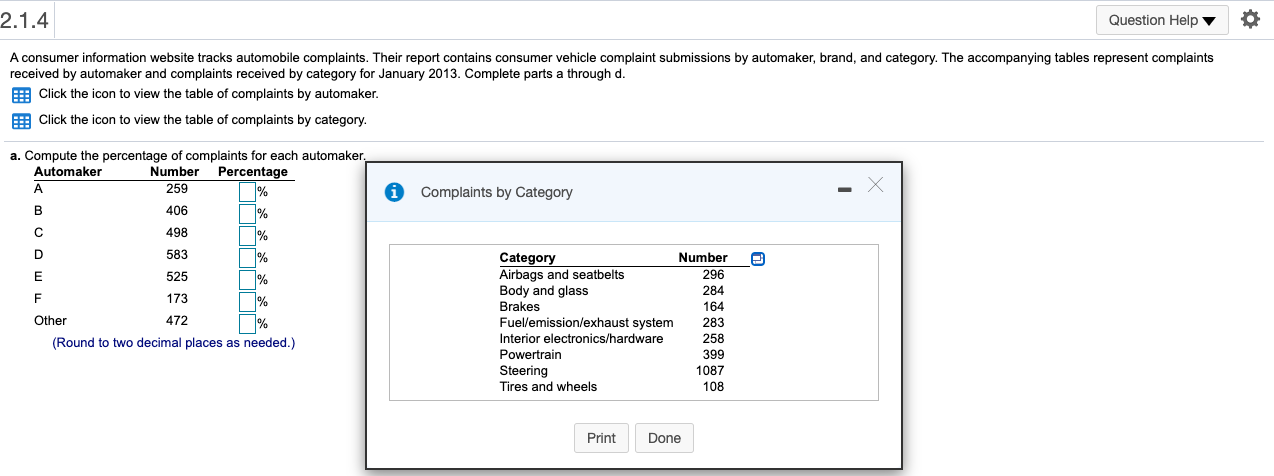
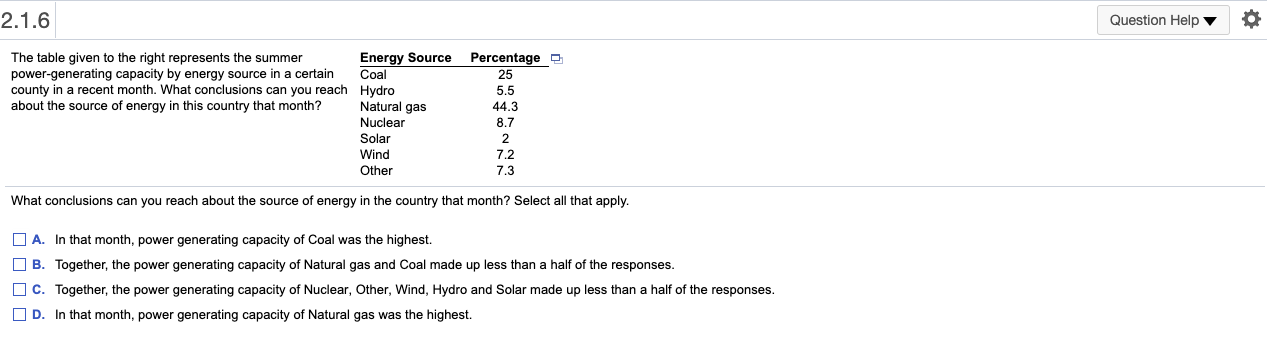
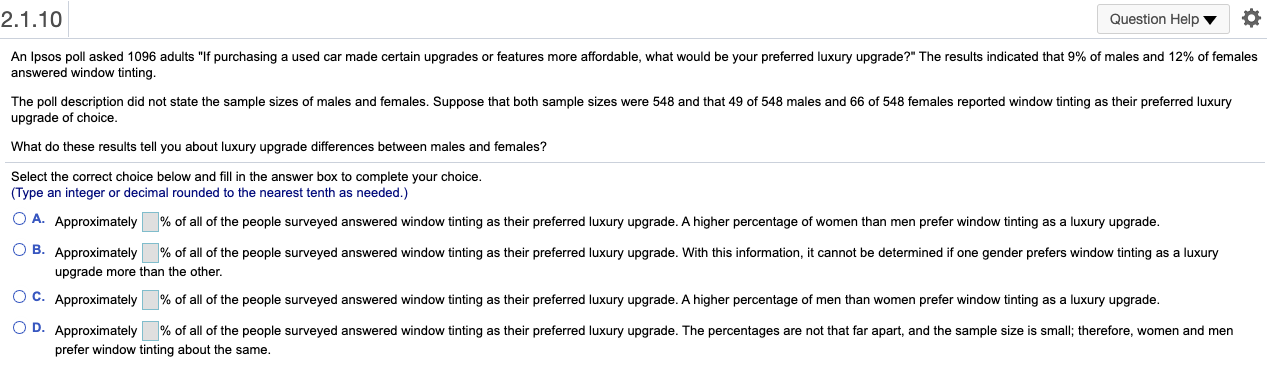
2.1.3 Question Help 0 The table to the right represents the annual percentage of smartphones sold in a certain region in 2011, 2012, and 2013 (projected). a. What conclusions can you reach about the market for smartphones in 2011, 2012, and 2013? b. What differences are there in the market for smartphones in 2011, 2012, and 2013? Type Type 1 Type 2 Type 3 Type 4 Type 5 Type 6 2011 52% 22% 1% 10% 13% 2% 2012 58% 23% 5% 7% 4% 3% 2013 47% 23% 22% 4% 1% 3% a. Select all that apply. A. Type 6 had the smallest or close to the smallest percentage of smartphones sold in all three years. B. Type 3 had the second largest percentage of smartphones sold in all three years. C. Type 5 had the smallest or close to the smallest percentage of smartphones sold in all three years. D. Type 1 had the largest percentage of smartphones sold in all three years. E. Type 2 had the second largest percentage of smartphones sold in all three years. Next Question 2.1.4 Question Help A consumer information website tracks automobile complaints. Their report contains consumer vehicle complaint submissions by automaker, brand, and category. The accompanying tables represent complaints received by automaker and complaints received by category for January 2013. Complete parts a through d. Click the icon to view the table of complaints by automaker. Click the icon to view the table of complaints by category. a. Compute the percentage of complaints for each automaker. Automaker Number Percentage A 259 % B 406 % 498 % D 583 % E 525 % F 173 % Other 472 % (Round to two decimal places as needed.) 2.1.4 Question Help A consumer information website tracks automobile complaints. Their report contains consumer vehicle complaint submissions by automaker, brand, and category. The accompanying tables represent complaints received by automaker and complaints received by category for January 2013. Complete parts a through d. Click the icon to view the table of complaints by automaker. Click the icon to view the table of complaints by category. Complaints by Automaker a. Compute the percentage of complaints for each automaker. Automaker Number Percentage A 259 % B 406 % 498 1% D 583 % E 525 % F 173 Other 472 (Round to two decimal places as needed.) Automaker A B Number 259 406 498 583 525 173 472 Other Print Done 2.1.4 Question Help A consumer information website tracks automobile complaints. Their report contains consumer vehicle complaint submissions by automaker, brand, and category. The accompanying tables represent complaints received by automaker and complaints received by category for January 2013. Complete parts a through d. Click the icon to view the table of complaints by automaker. Click the icon to view the table of complaints by category. Complaints by Category a. Compute the percentage of complaints for each automaker, Automaker Number Percentage A 259 % B 406 % 498 % D 583 % E 525 1% F 173 1% 472 % (Round to two decimal places as needed.) Other Category Number Airbags and seatbelts 296 Body and glass 284 Brakes 164 Fuel/emission/exhaust system 283 Interior electronics/hardware 258 Powertrain 399 Steering 1087 Tires and wheels 108 Print Done 2.1.6 Question Help The table given to the right represents the summer Energy Source power-generating capacity by energy source in a certain Coal county in a recent month. What conclusions can you reach Hydro about the source of energy in this country that month? Natural gas Nuclear Solar Wind Percentage 25 5.5 44.3 8.7 2 7.2 7.3 Other What conclusions can you reach about the source of energy in the country that month? Select all that apply. A. In that month, power generating capacity of Coal was the highest. B. Together, the power generating capacity of Natural gas and Coal made up less than a half of the responses. C. Together, the power generating capacity of Nuclear, Other, Wind, Hydro and Solar made up less than a half of the responses. D. In that month, power generating capacity of Natural gas was the highest. 2.1.10 Question Help An Ipsos poll asked 1096 adults "If purchasing a used car made certain upgrades or features more affordable, what would be your preferred luxury upgrade?" The results indicated that 9% of males and 12% of females answered window tinting. The poll description did not state the sample sizes of males and females. Suppose that both sample sizes were 548 and that 49 of 548 males and 66 of 548 females reported window tinting as their preferred luxury upgrade of choice. What do these results tell you about luxury upgrade differences between males and females? Select the correct choice below and fill in the answer box to complete your choice. (Type an integer or decimal rounded to the nearest tenth as needed.) O A. Approximately % of all of the people surveyed answered window tinting as their preferred luxury upgrade. A higher percentage of women than men prefer window tinting as a luxury upgrade. OB. Approximately % of all of the people surveyed answered window tinting as their preferred luxury upgrade. With this information, it cannot be determined if one gender prefers window tinting as a luxury upgrade more than the other. OC. Approximately % of all of the people surveyed answered window tinting as their preferred luxury upgrade. A higher percentage of men than women prefer window tinting as a luxury upgrade. OD. Approximately % of all of the people surveyed answered window tinting as their preferred luxury upgrade. The percentages are not that far apart, and the sample size is small; therefore, women and men prefer window tinting about the same


