

Question: how do i answer b The table to the right represents the annual percentage of smartphones sold in a certain region in 2011, 2012, and
how do i answer b
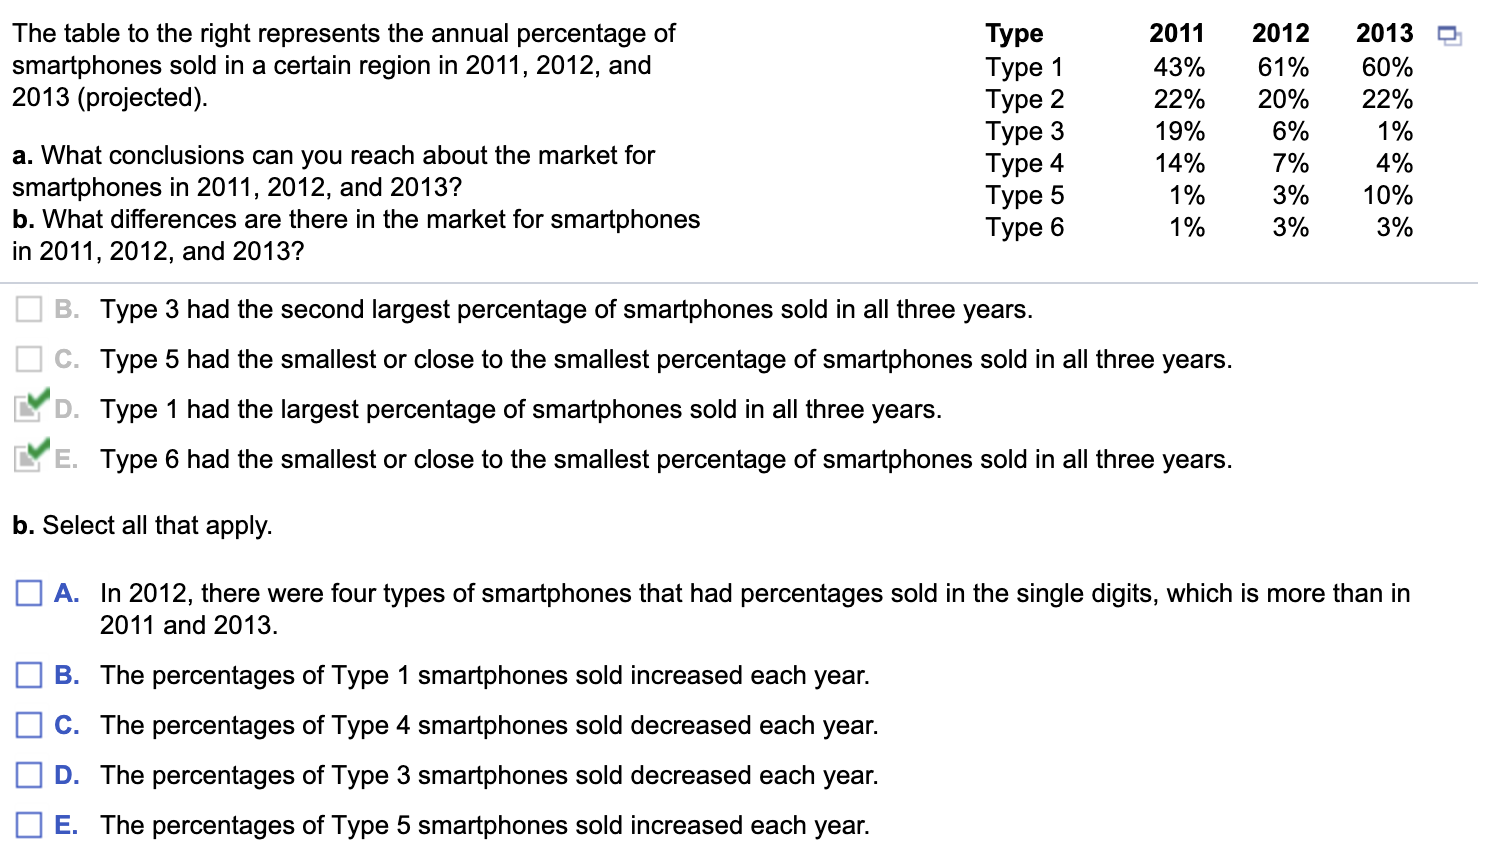
The table to the right represents the annual percentage of smartphones sold in a certain region in 2011, 2012, and 2013 (projected). a. What conclusions can you reach about the market for smartphones in 2011, 2012, and 2013? b. What differences are there in the market for smartphones in 2011, 2012, and 2013? Type Type 1 Type 2 Type 3 Type 4 Type 5 Type 6 B. Type 3 had the second largest percentage of smartphones sold in all three years. C. Type 5 had the smallest or close to the smallest percentage of smartphones sold in all three years. it\" D. Type 1 had the largest percentage of smartphones sold in all three years. in\" E. Type 6 had the smallest or close to the smallest percentage of smartphones sold in all three years. b. Select all that apply. 2011 43% 22% 19% 14% 1% 1% 2012 61% 20% 6% 7% 3% 3% 2013 60% 22% 1% 4% 10% 3% 1:] A. In 2012, there were four types of smartphones that had percentages sold in the single digits, which is more than in 2011 and 2013. 1:] B. The percentages of Type 1 smartphones sold increased each year. E] c. The percentages of Type 4 smartphones sold decreased each year. E] D. The percentages of Type 3 smartphones sold decreased each year. 1:] E. The percentages of Type 5 smartphones sold increased each year
Step by Step Solution
There are 3 Steps involved in it

Get step-by-step solutions from verified subject matter experts