

Question: 2.2 Organizing Quantitative Data X Do Homework - 2.2 Organizing C X C A survey recently went out to 15 x Homework Help - Q&A
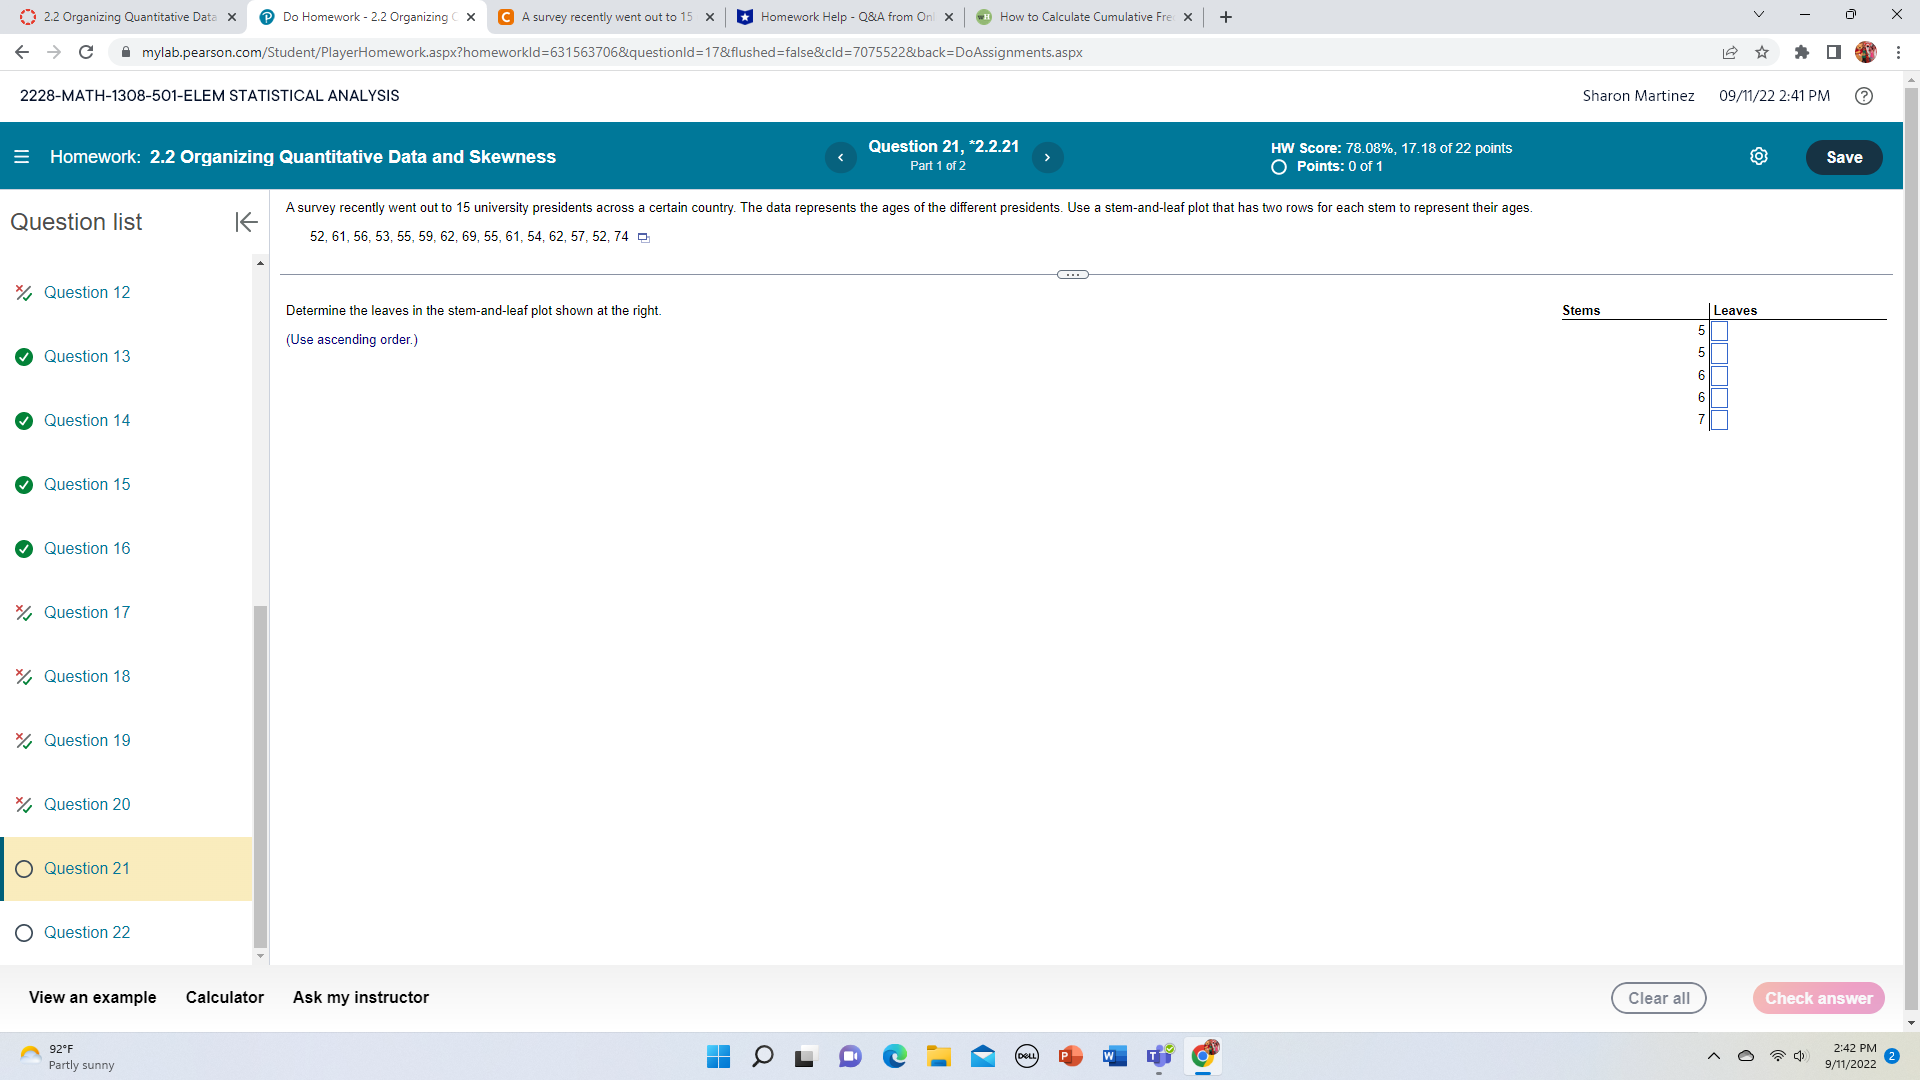

2.2 Organizing Quantitative Data X Do Homework - 2.2 Organizing C X C A survey recently went out to 15 x Homework Help - Q&A from Onl x | How to Calculate Cumulative Fre X + X A mylab.pearson.com/Student/PlayerHomework.aspx?homeworkld=631563706&questionld=17&flushed=false&cld=7075522&back=DoAssignments.aspx 2228-MATH-1308-501-ELEM STATISTICAL ANALYSIS Sharon Martinez 09/11/22 2:41 PM ? Homework: 2.2 Organizing Quantitative Data and Skewness Question 21, *2.2.21 HW Score: 78.08%, 17.18 of 22 points Part 1 of 2 O Points: 0 of 1 Save Question list K A survey recently went out to 15 university presidents across a certain country. The data represents the ages of the different presidents. Use a stem-and-leaf plot that has two rows for each stem to represent their ages. 52, 61, 56, 53, 55, 59, 62, 69, 55, 61, 54, 62, 57, 52, 74 Question 12 Determine the leaves in the stem-and-leaf plot shown at the right. Stems Leaves (Use ascending order.) Question 13 UT O Question 14 Question 15 Question 16 Question 17 Question 18 Question 19 Question 20 O Question 21 Question 22 View an example Calculator Ask my instructor Clear all Check answer 2:42 PM Partly sunny 9/11/2022
Step by Step Solution
There are 3 Steps involved in it

Get step-by-step solutions from verified subject matter experts