

Question: 2.2.2 a notebook computer and a smartphone and a tablet. (3) 2.2 The Venn diagram below represents the following data. A= the number of households
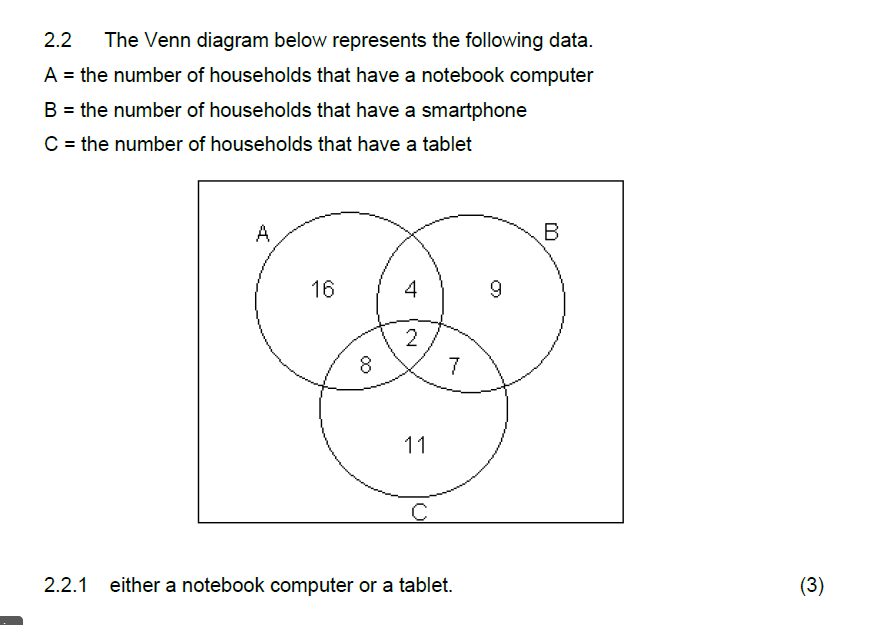
2.2.2 a notebook computer and a smartphone and a tablet. (3)
2.2 The Venn diagram below represents the following data. A= the number of households that have a notebook computer B= the number of households that have a smartphone C= the number of households that have a tablet 2.2.1 either a notebook computer or a tablet. (3)
Step by Step Solution
There are 3 Steps involved in it
1 Expert Approved Answer
Step: 1 Unlock

Question Has Been Solved by an Expert!
Get step-by-step solutions from verified subject matter experts
Step: 2 Unlock
Step: 3 Unlock