

Question: 2.2.3 Calculator Commands to Create a Histogram Create a list and enter the data in the desired L1 or L2. 1. Open the STAT
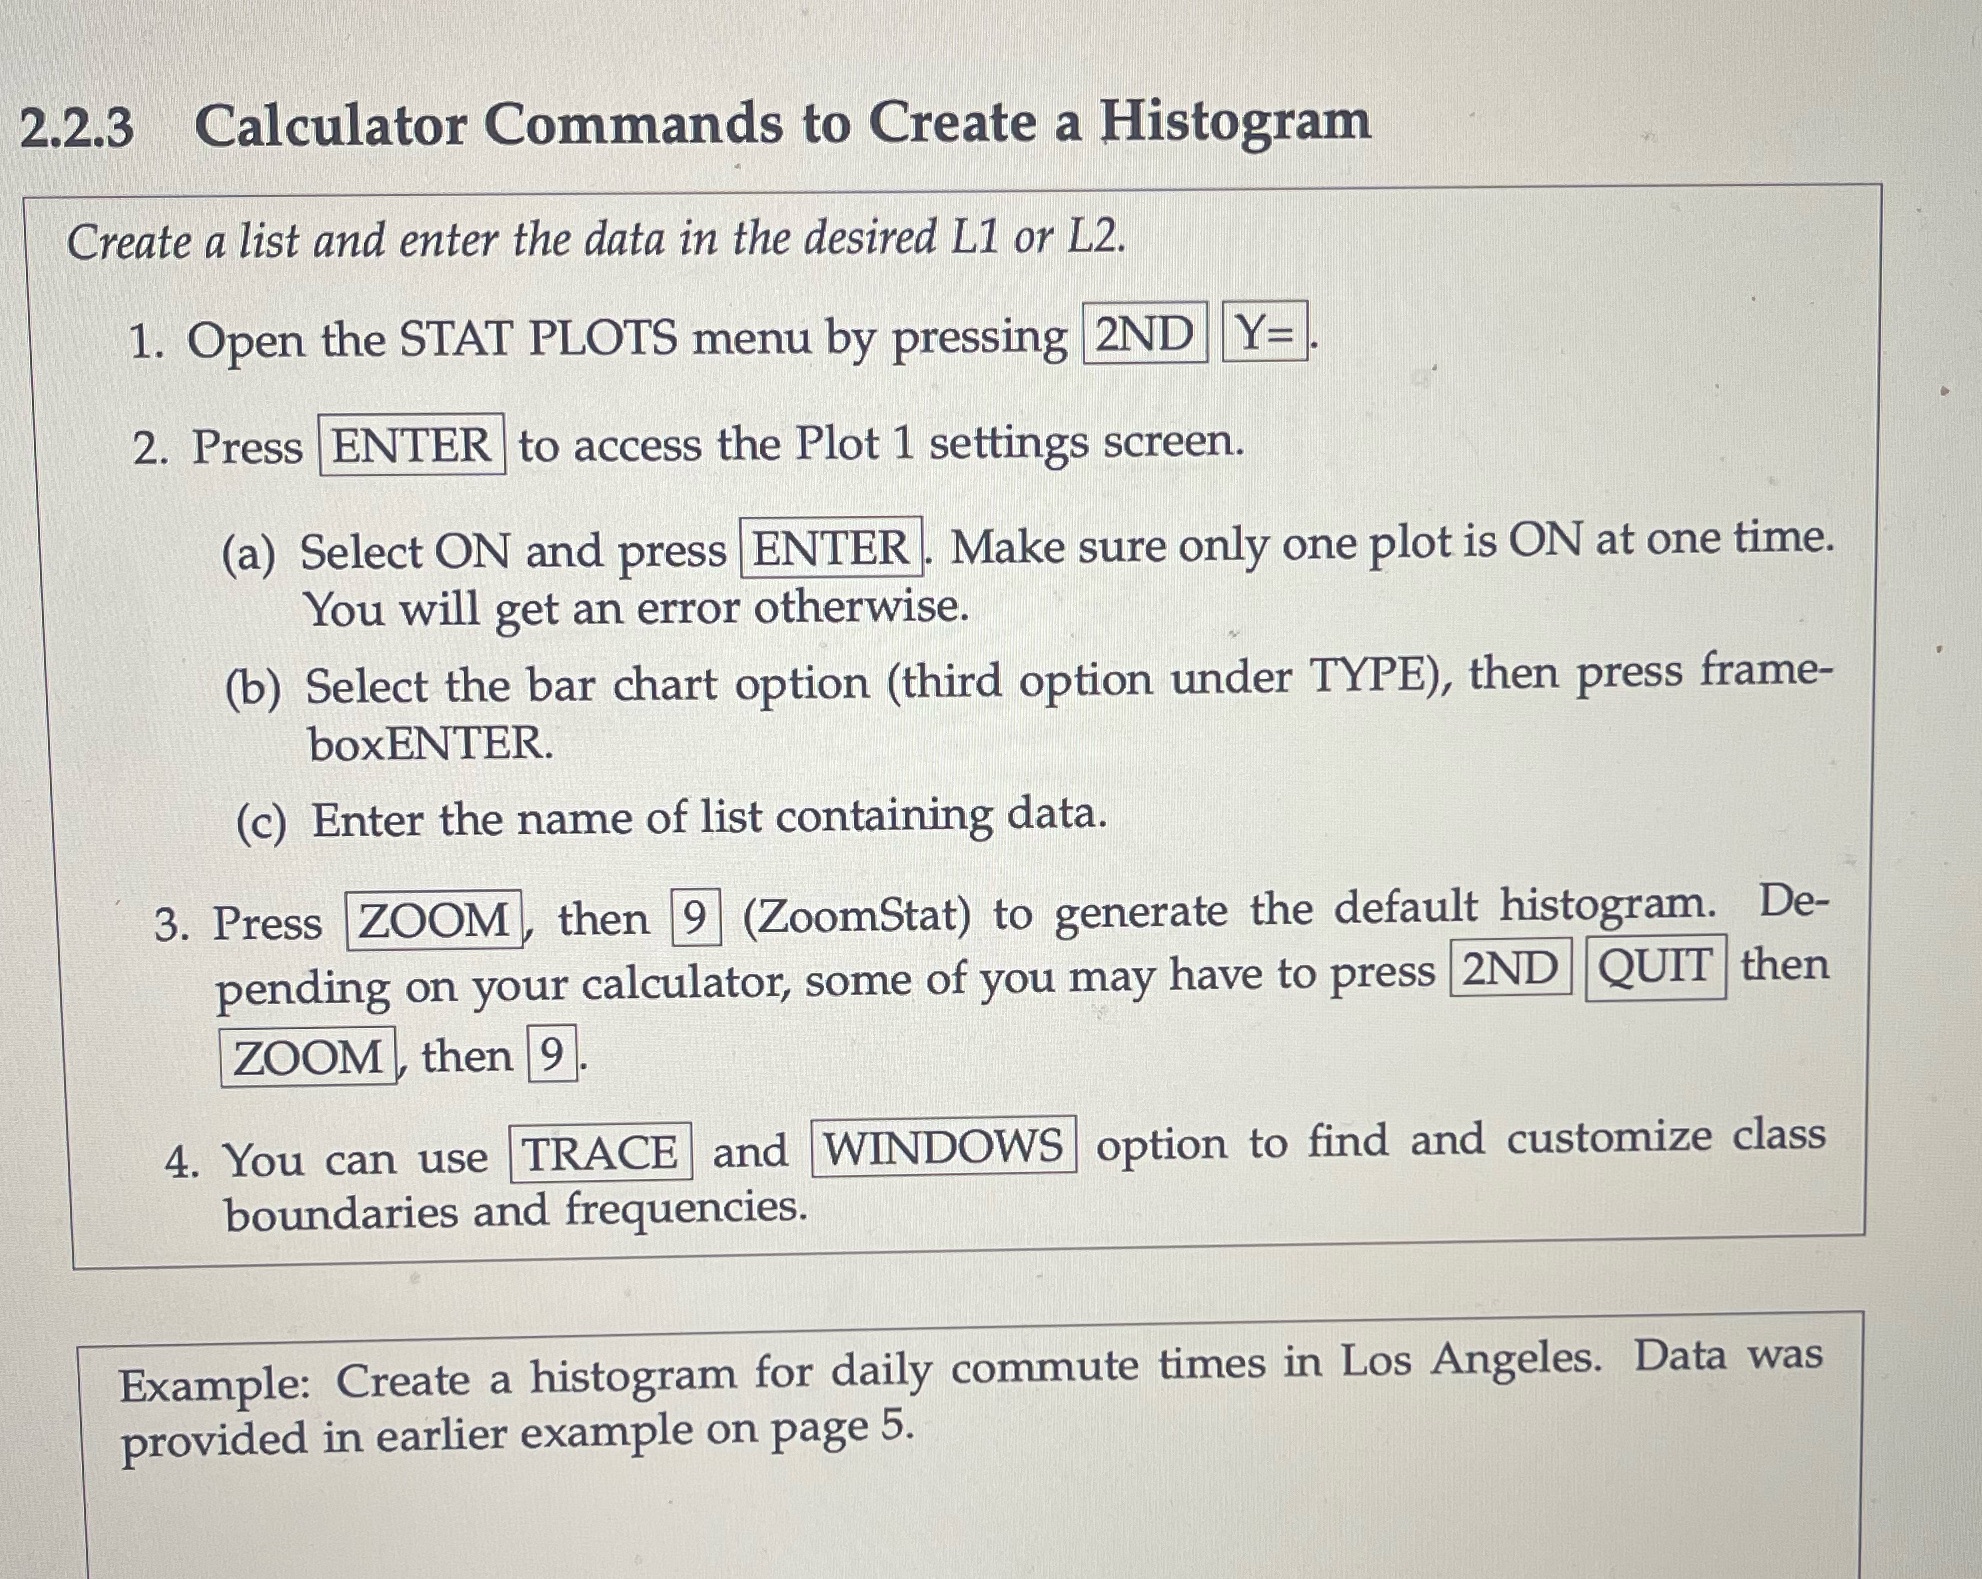
2.2.3 Calculator Commands to Create a Histogram Create a list and enter the data in the desired L1 or L2. 1. Open the STAT PLOTS menu by pressing 2ND Y= 2. Press ENTER to access the Plot 1 settings screen. (a) Select ON and press ENTER. Make sure only one plot is ON at one time. You will get an error otherwise. (b) Select the bar chart option (third option under TYPE), then press boxENTER. (c) Enter the name of list containing data. frame- De- 3. Press ZOOM, then 9 (ZoomStat) to generate the default histogram. pending on your calculator, some of you may have to press 2ND QUIT then ZOOM, then 9. 4. You can use TRACE and WINDOWS option to find and customize class boundaries and frequencies. Example: Create a histogram for daily commute times in Los Angeles. Data was provided in earlier example on page 5.
Step by Step Solution
There are 3 Steps involved in it

Get step-by-step solutions from verified subject matter experts