

Question: Please help me with this question. Thank you so much!!! Question 13 1 pts A confidence interval is an interval approximation for the population parameter.
Please help me with this question. Thank you so much!!!
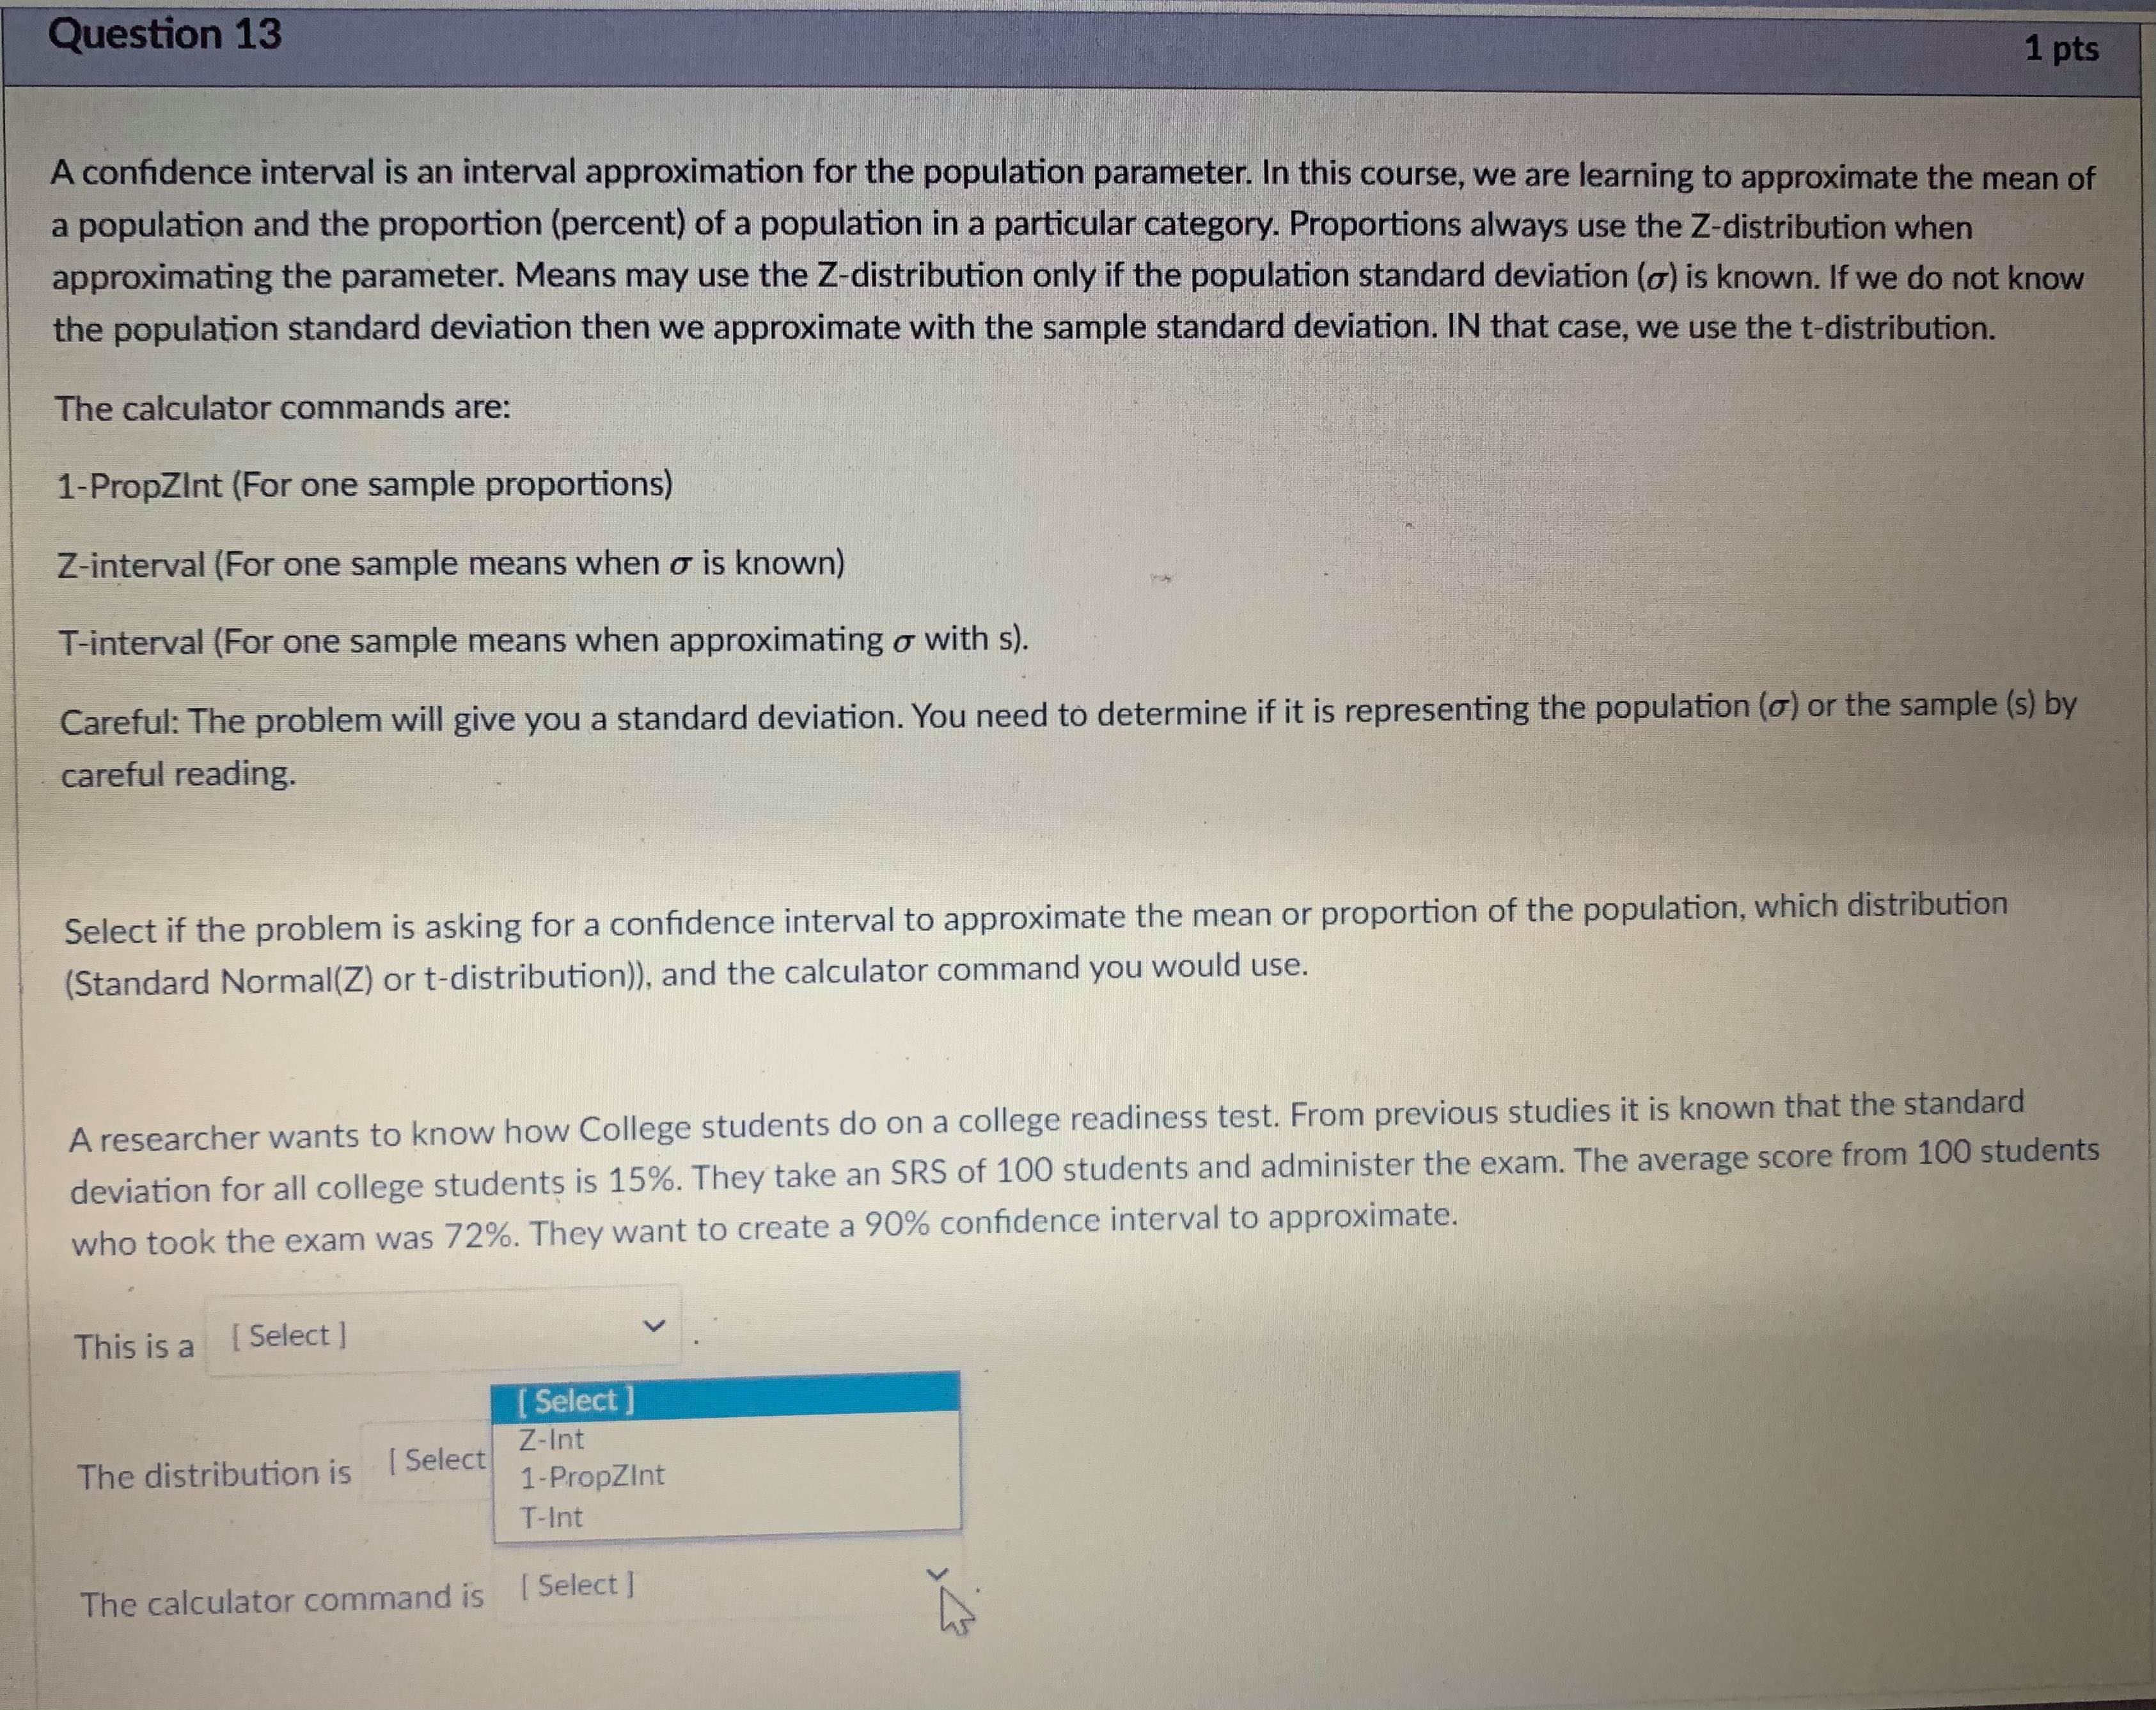
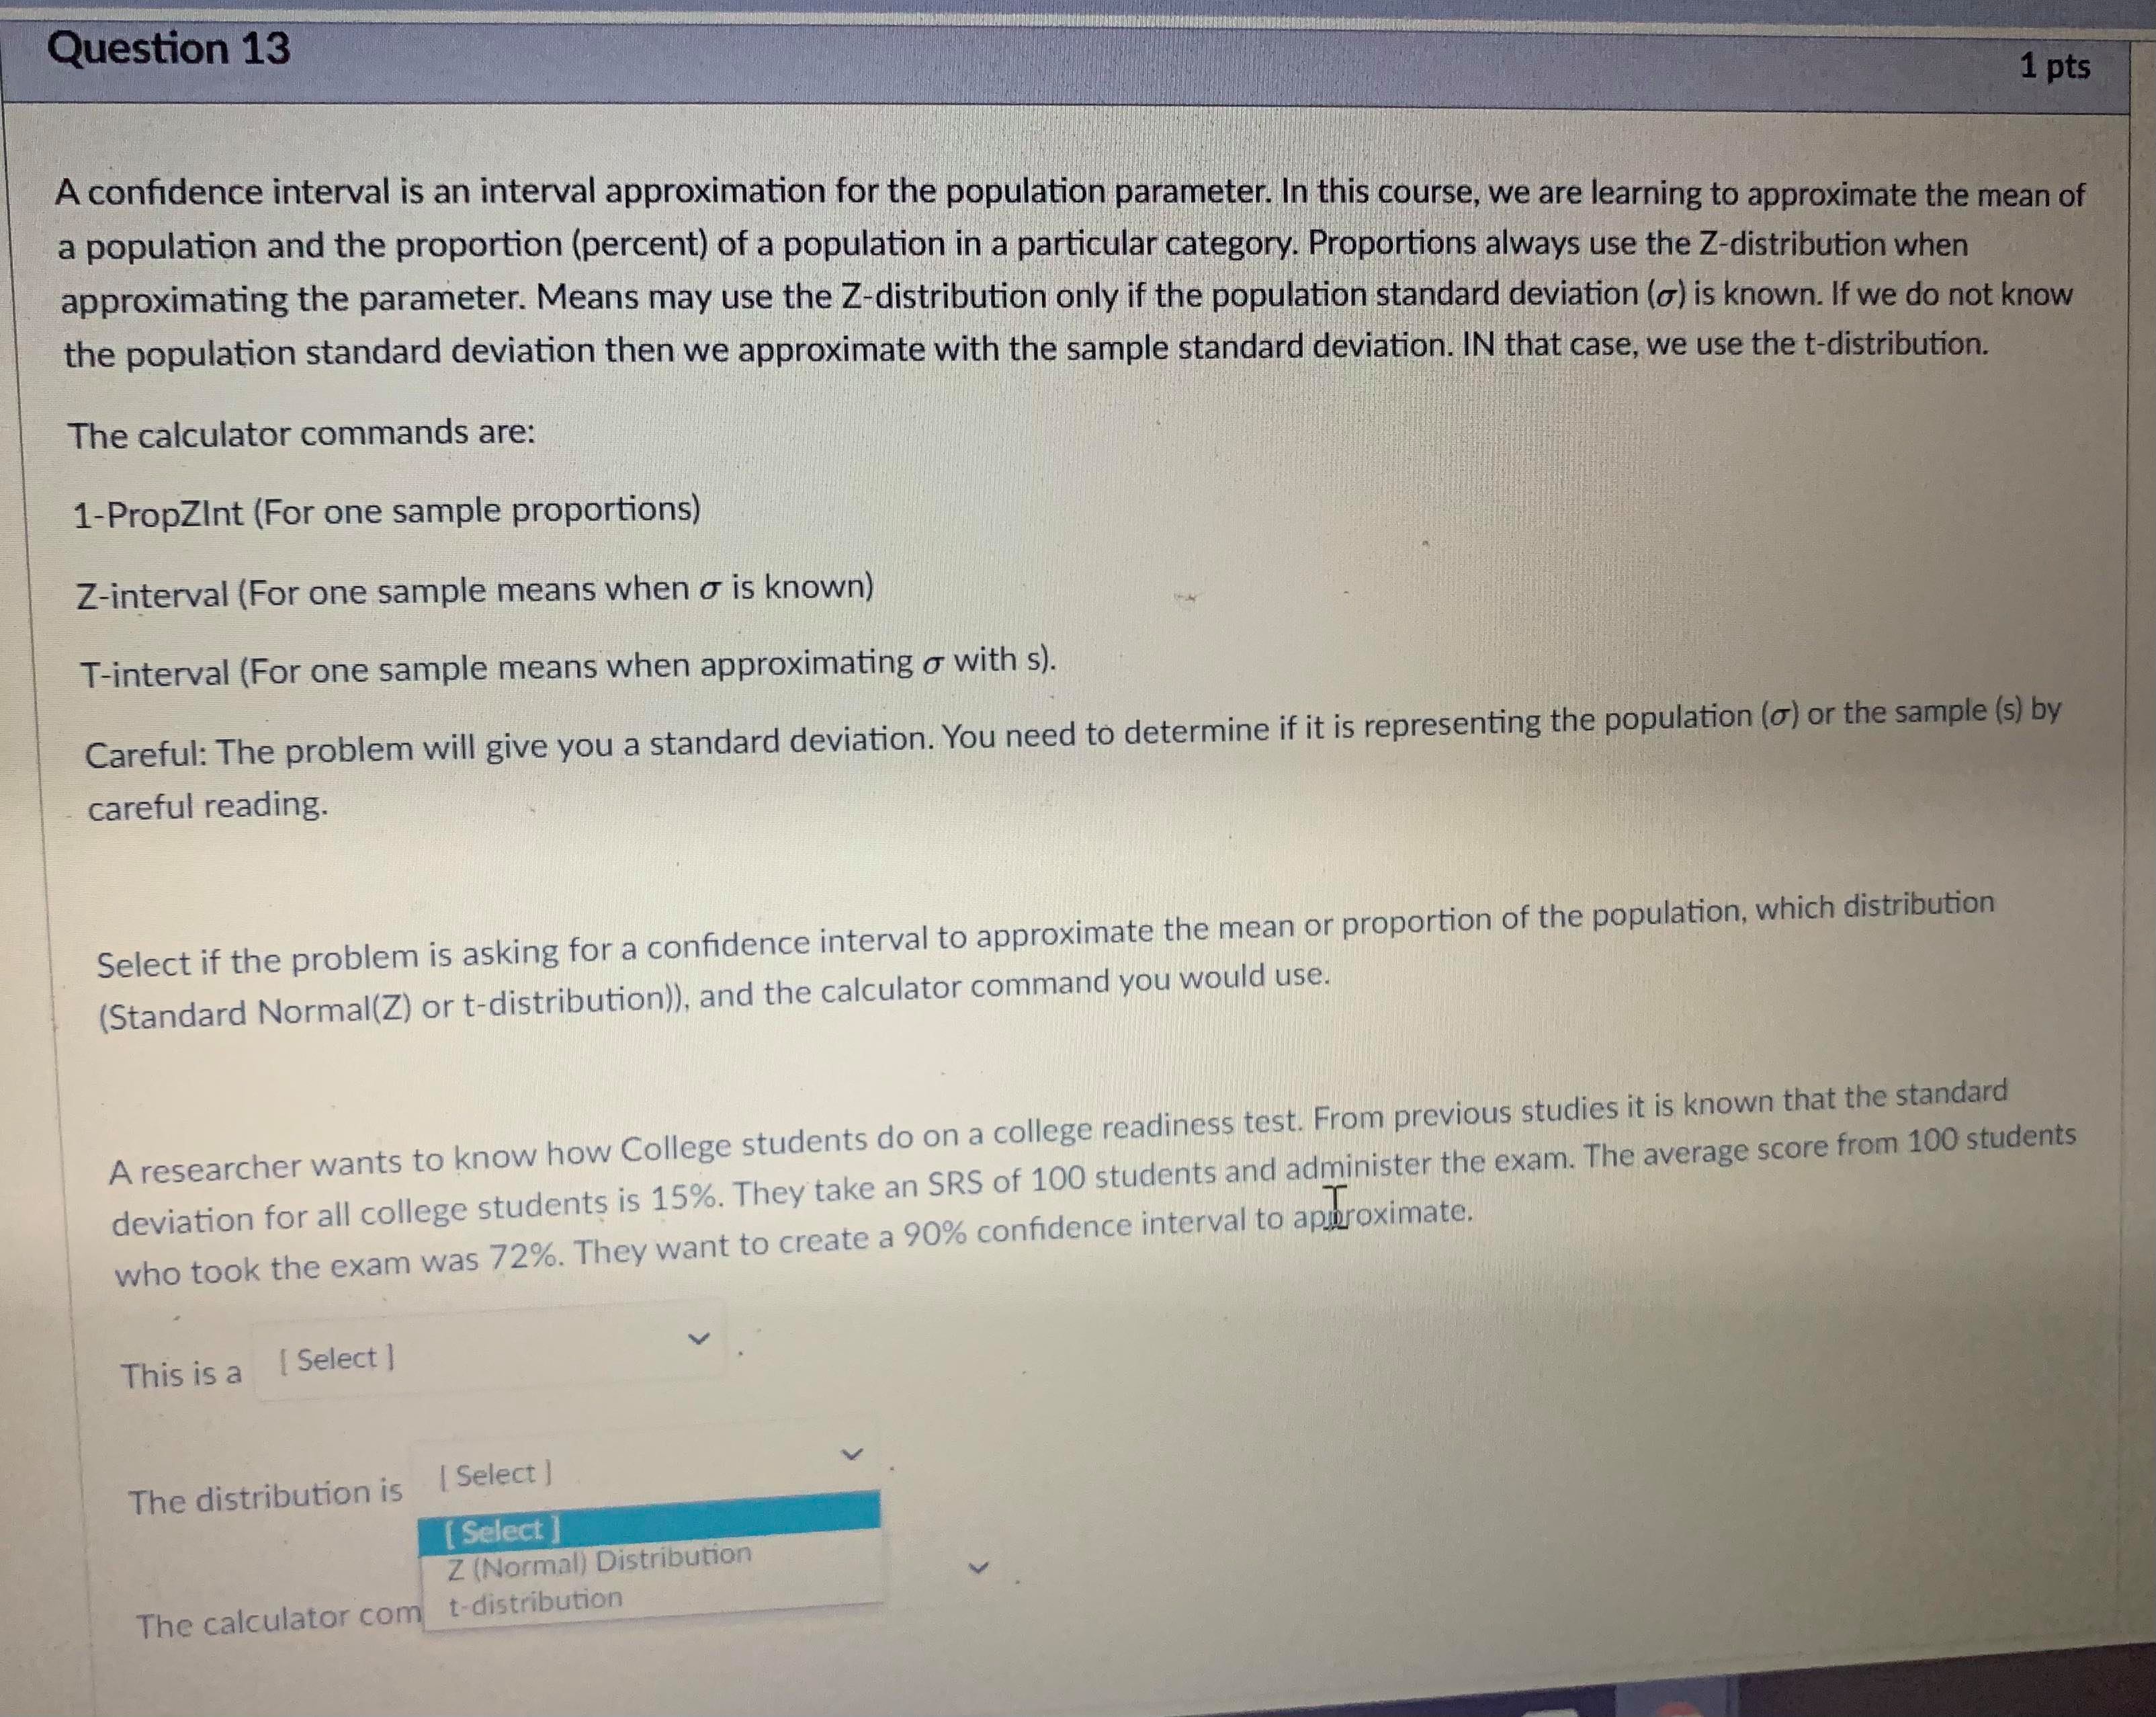
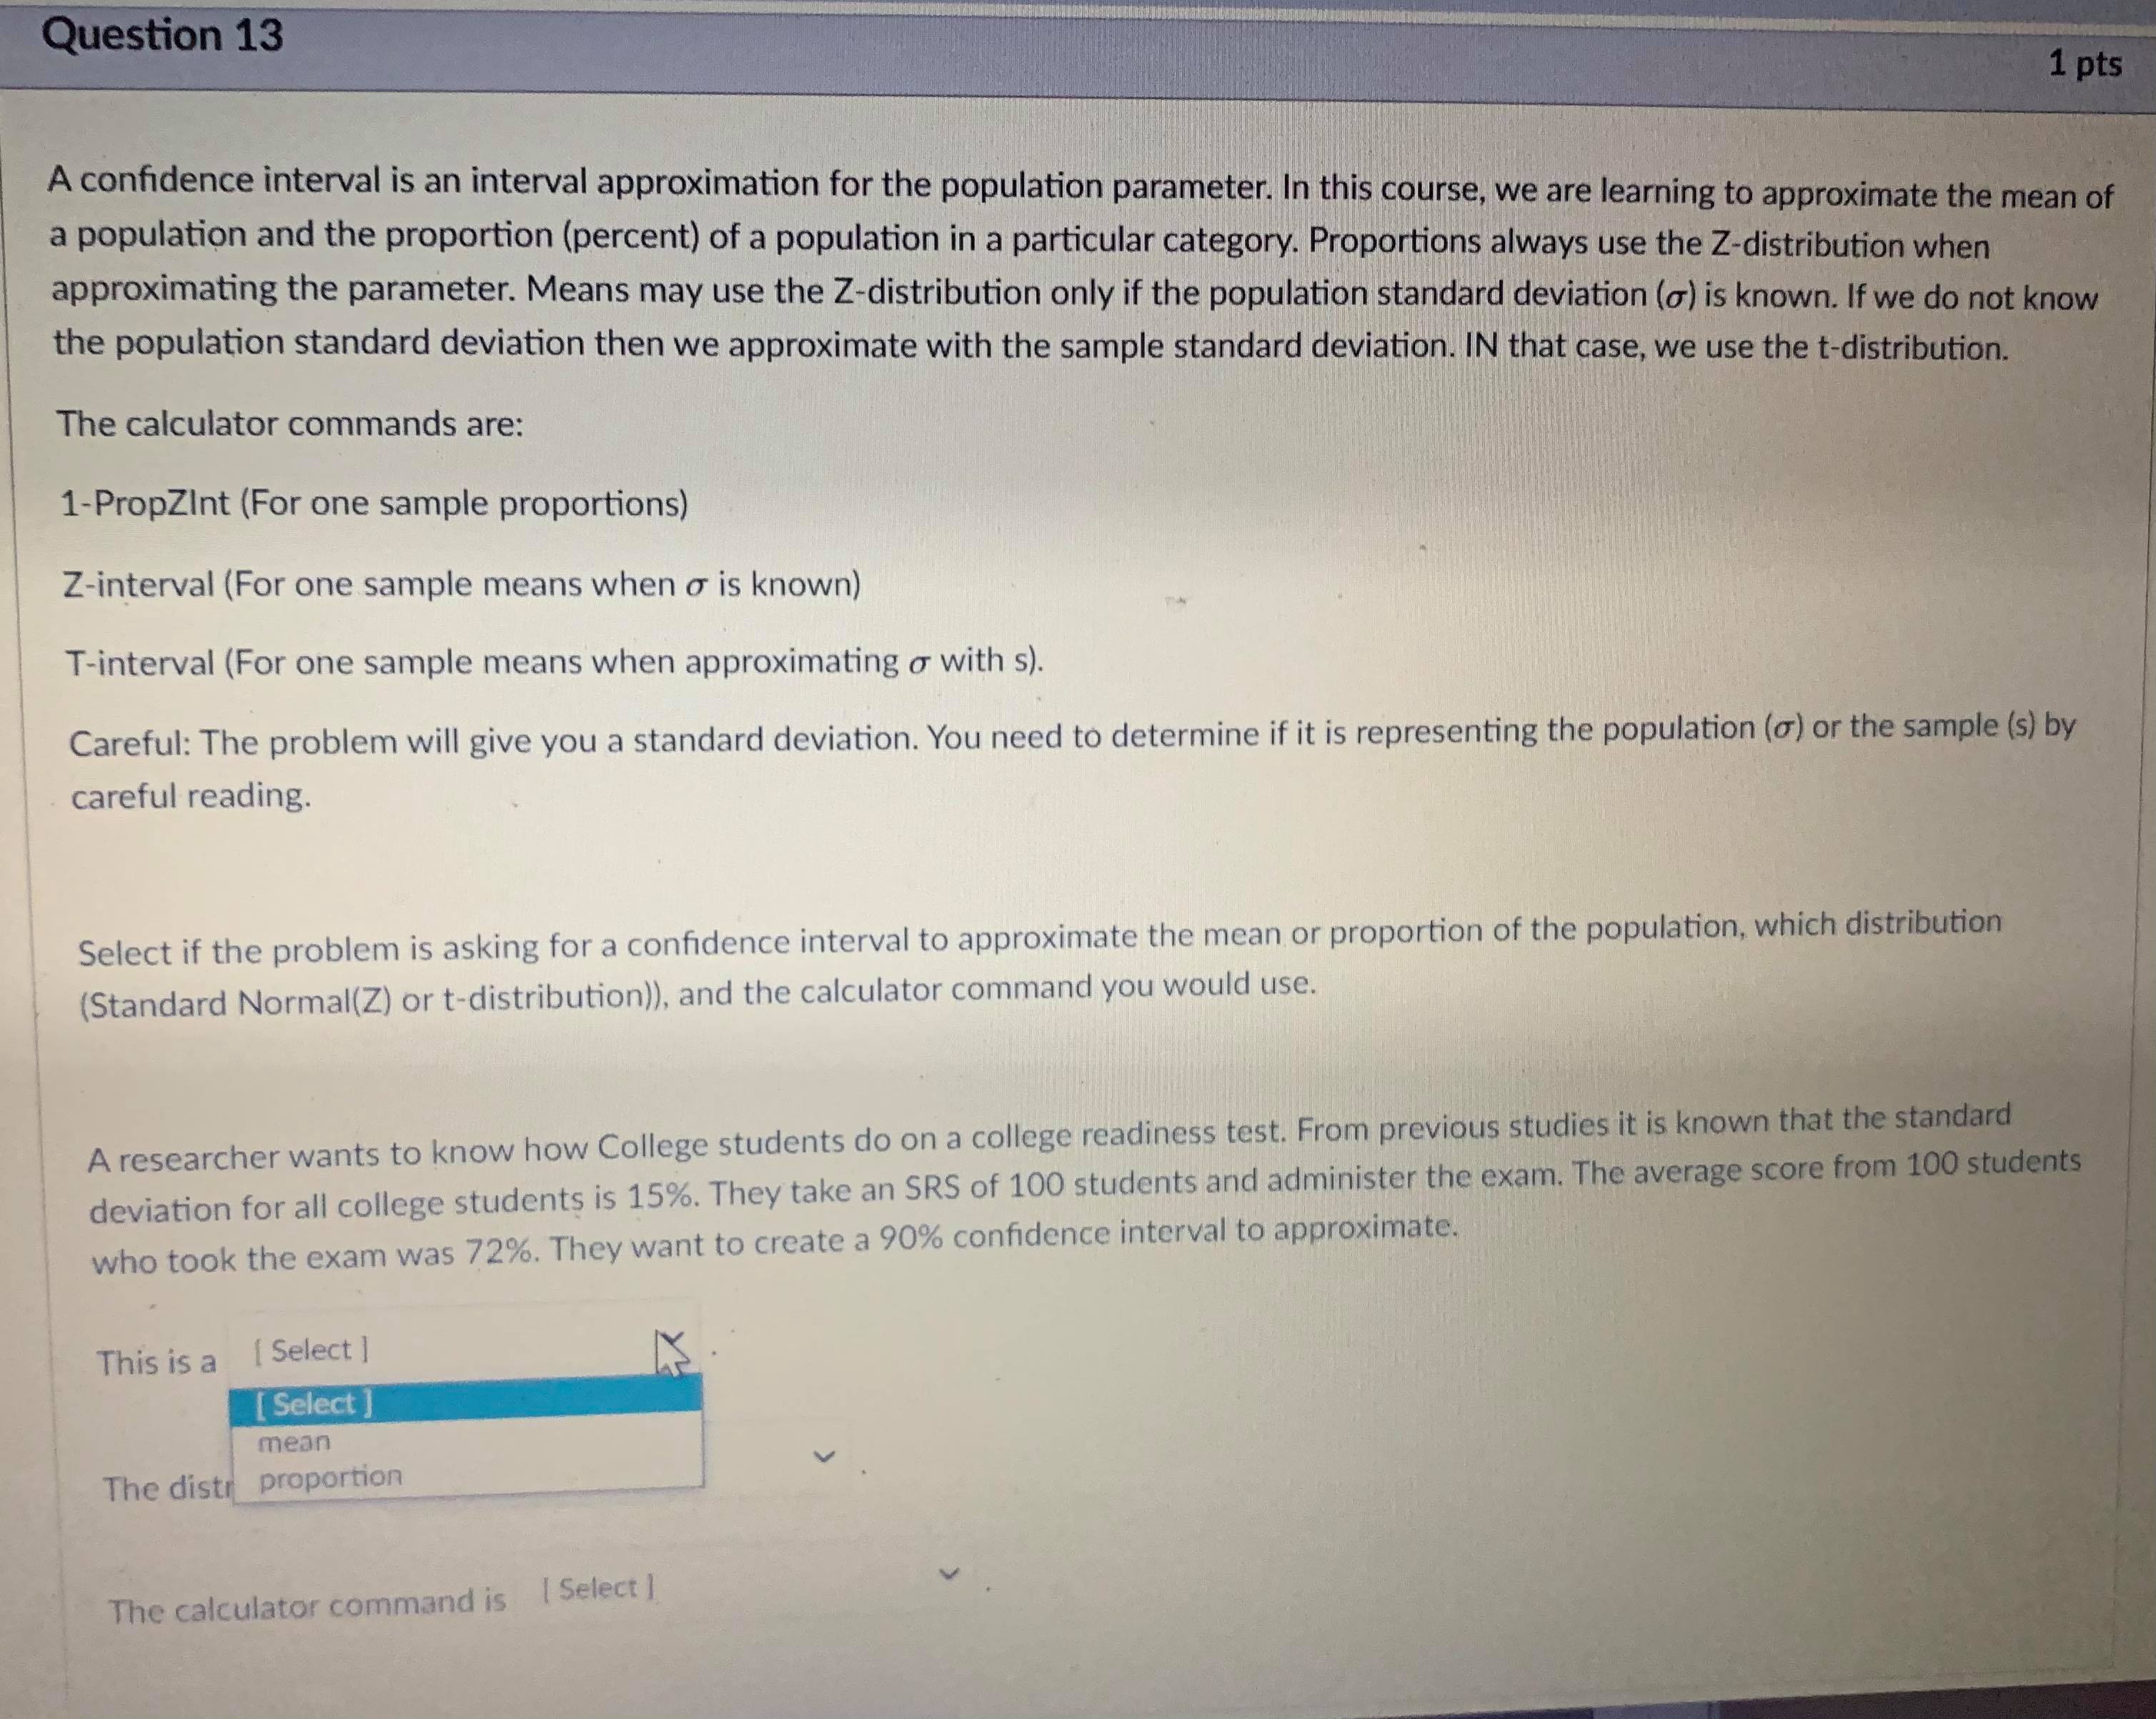
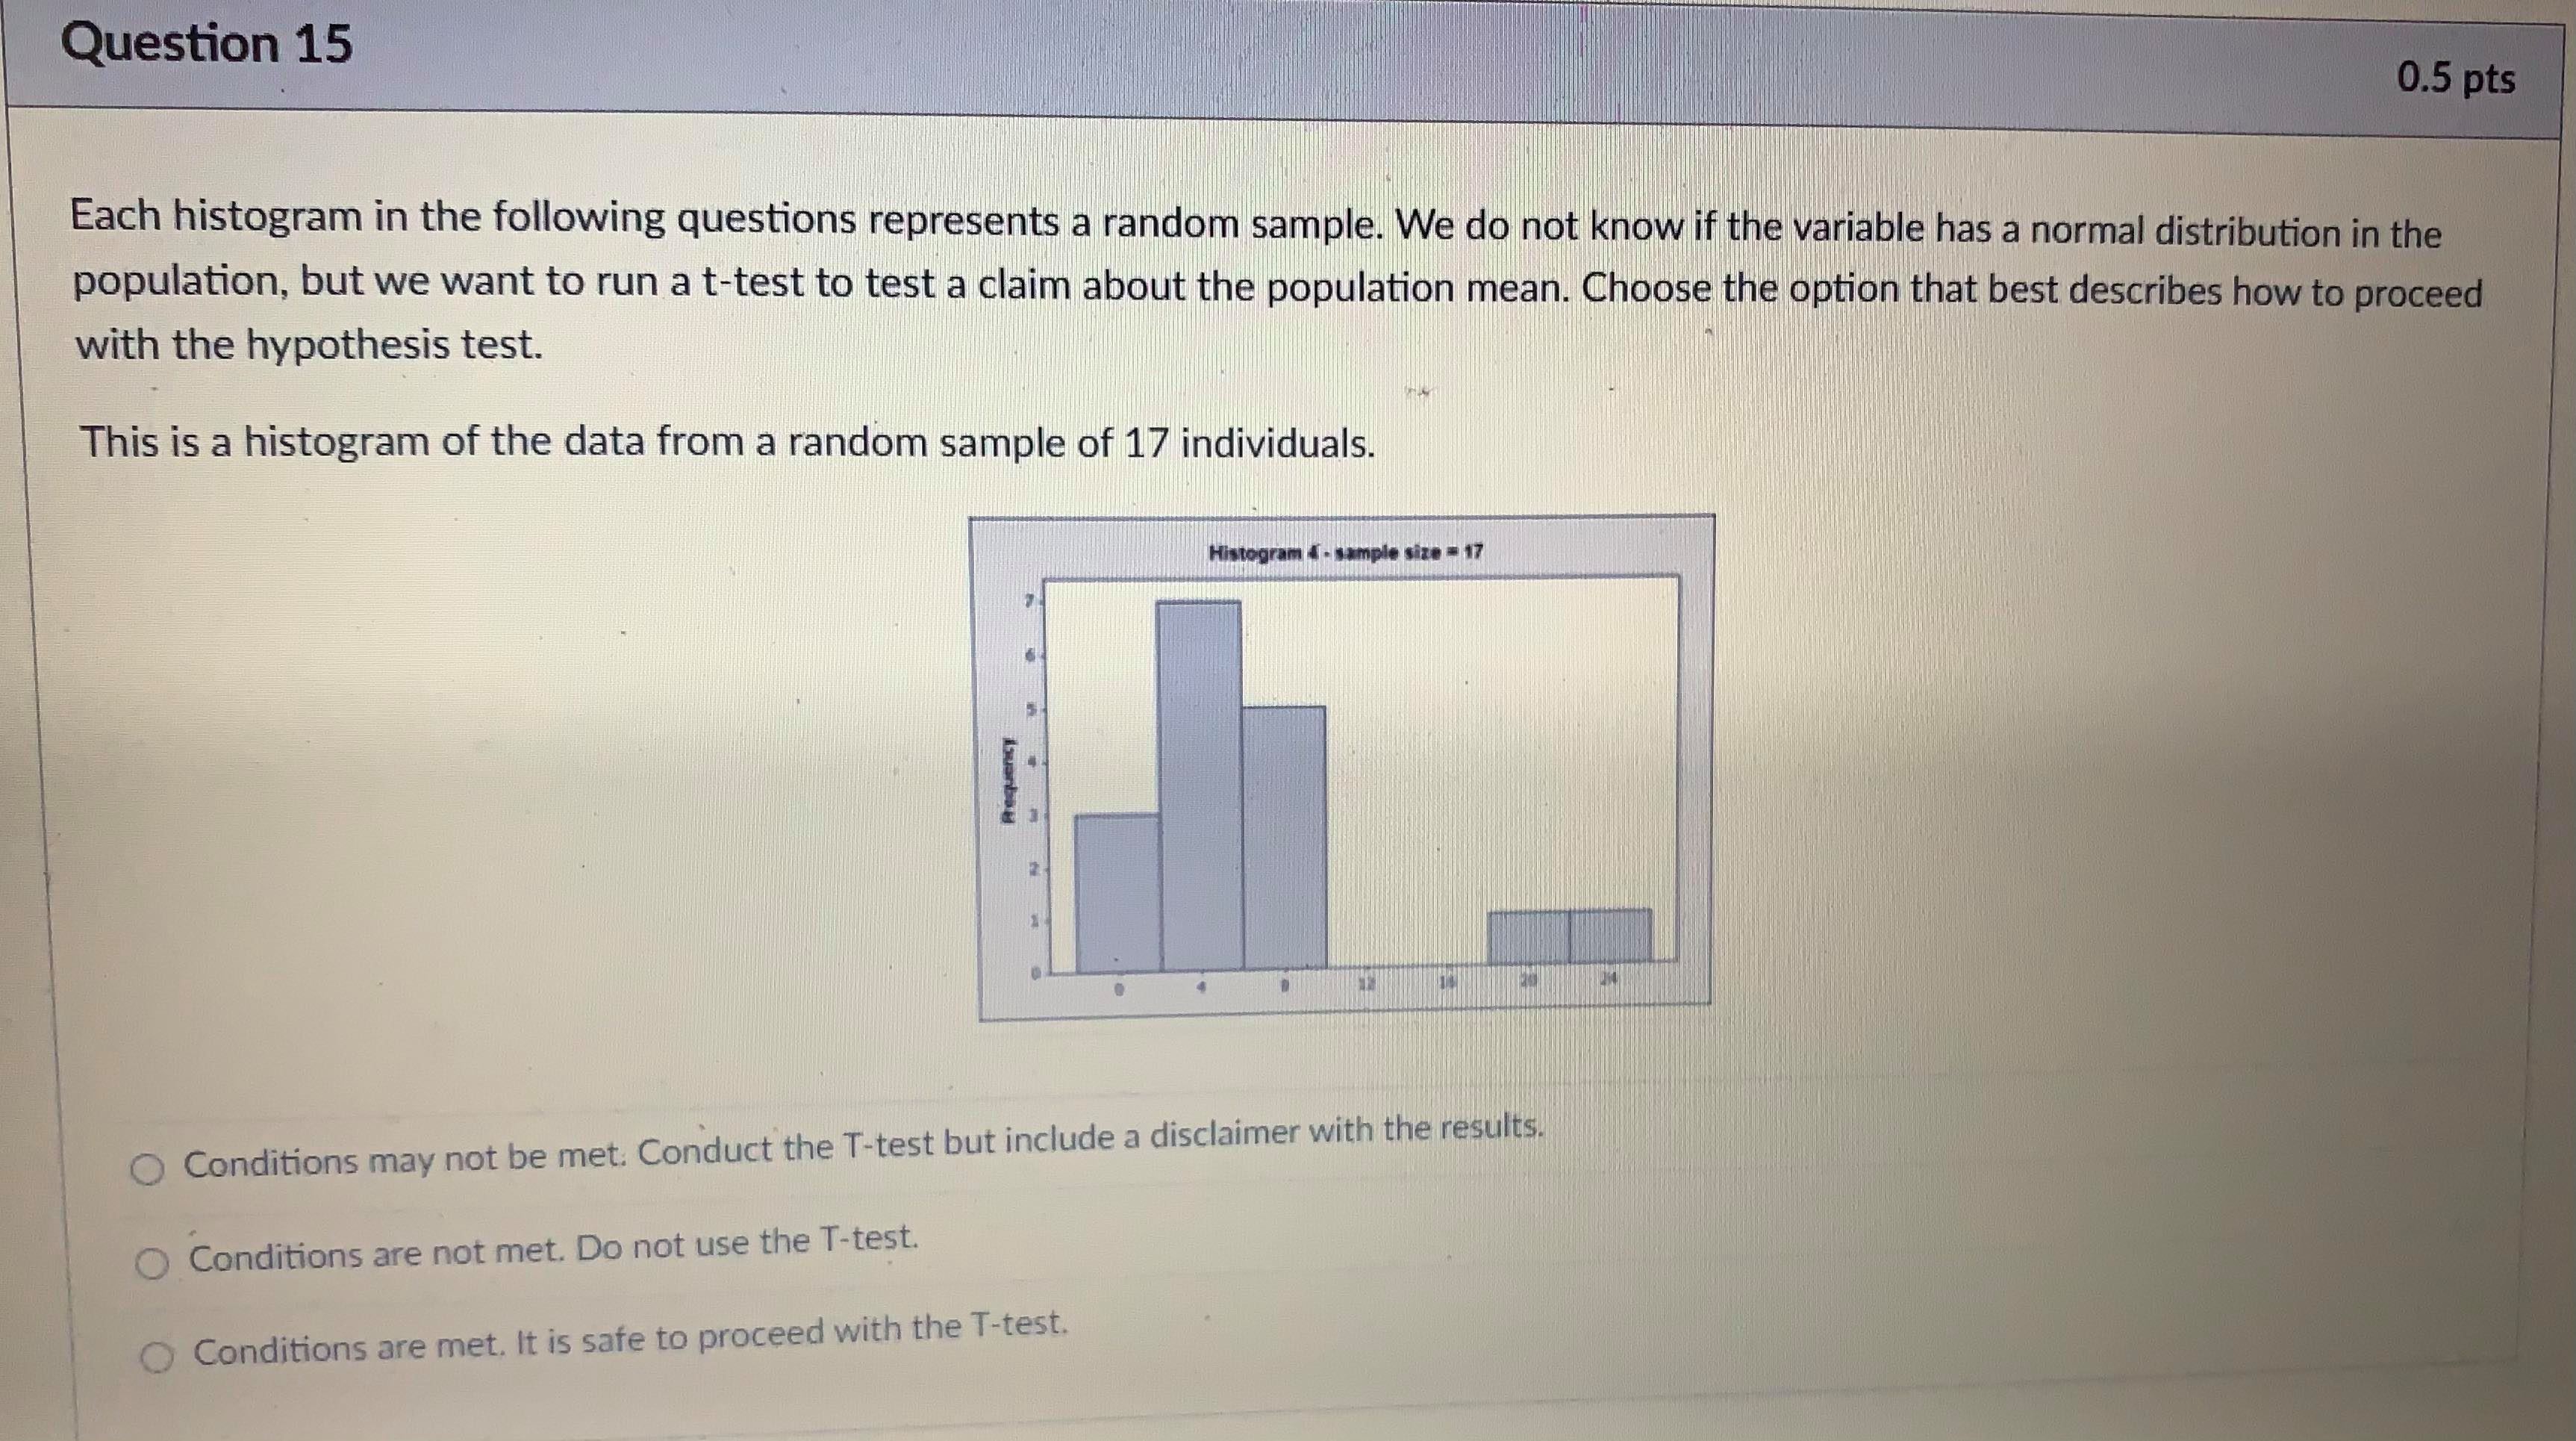
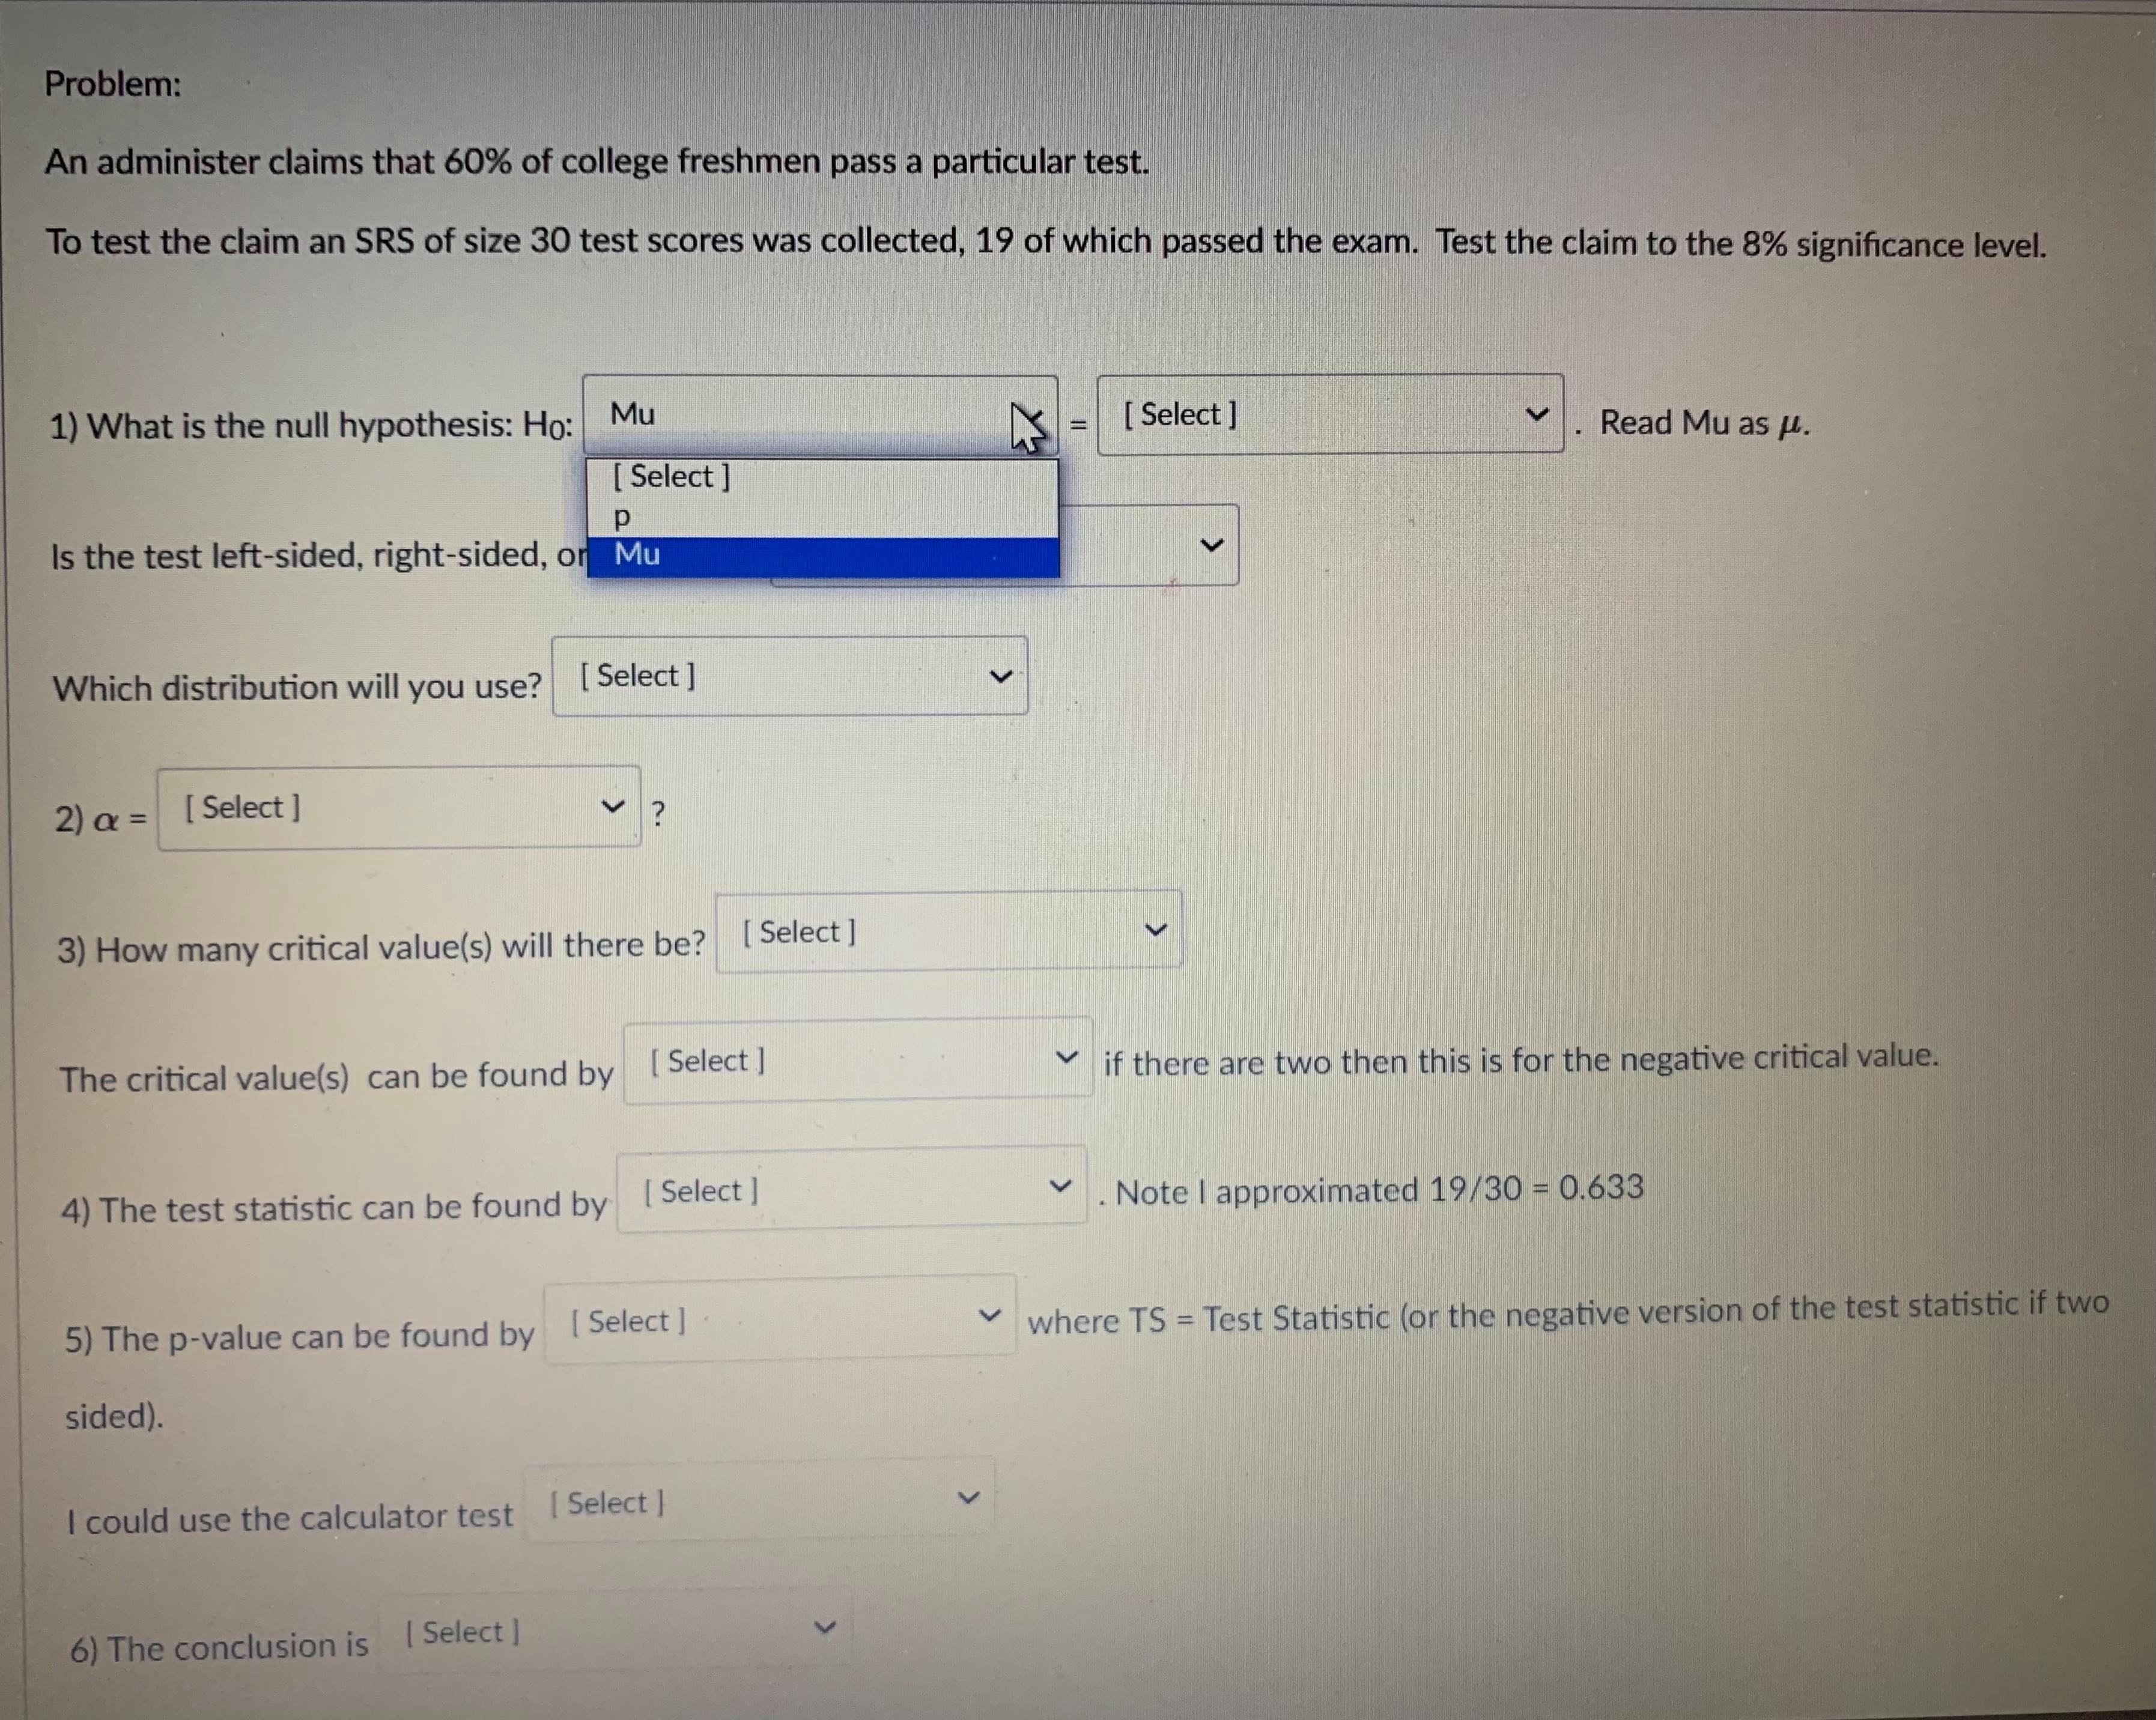
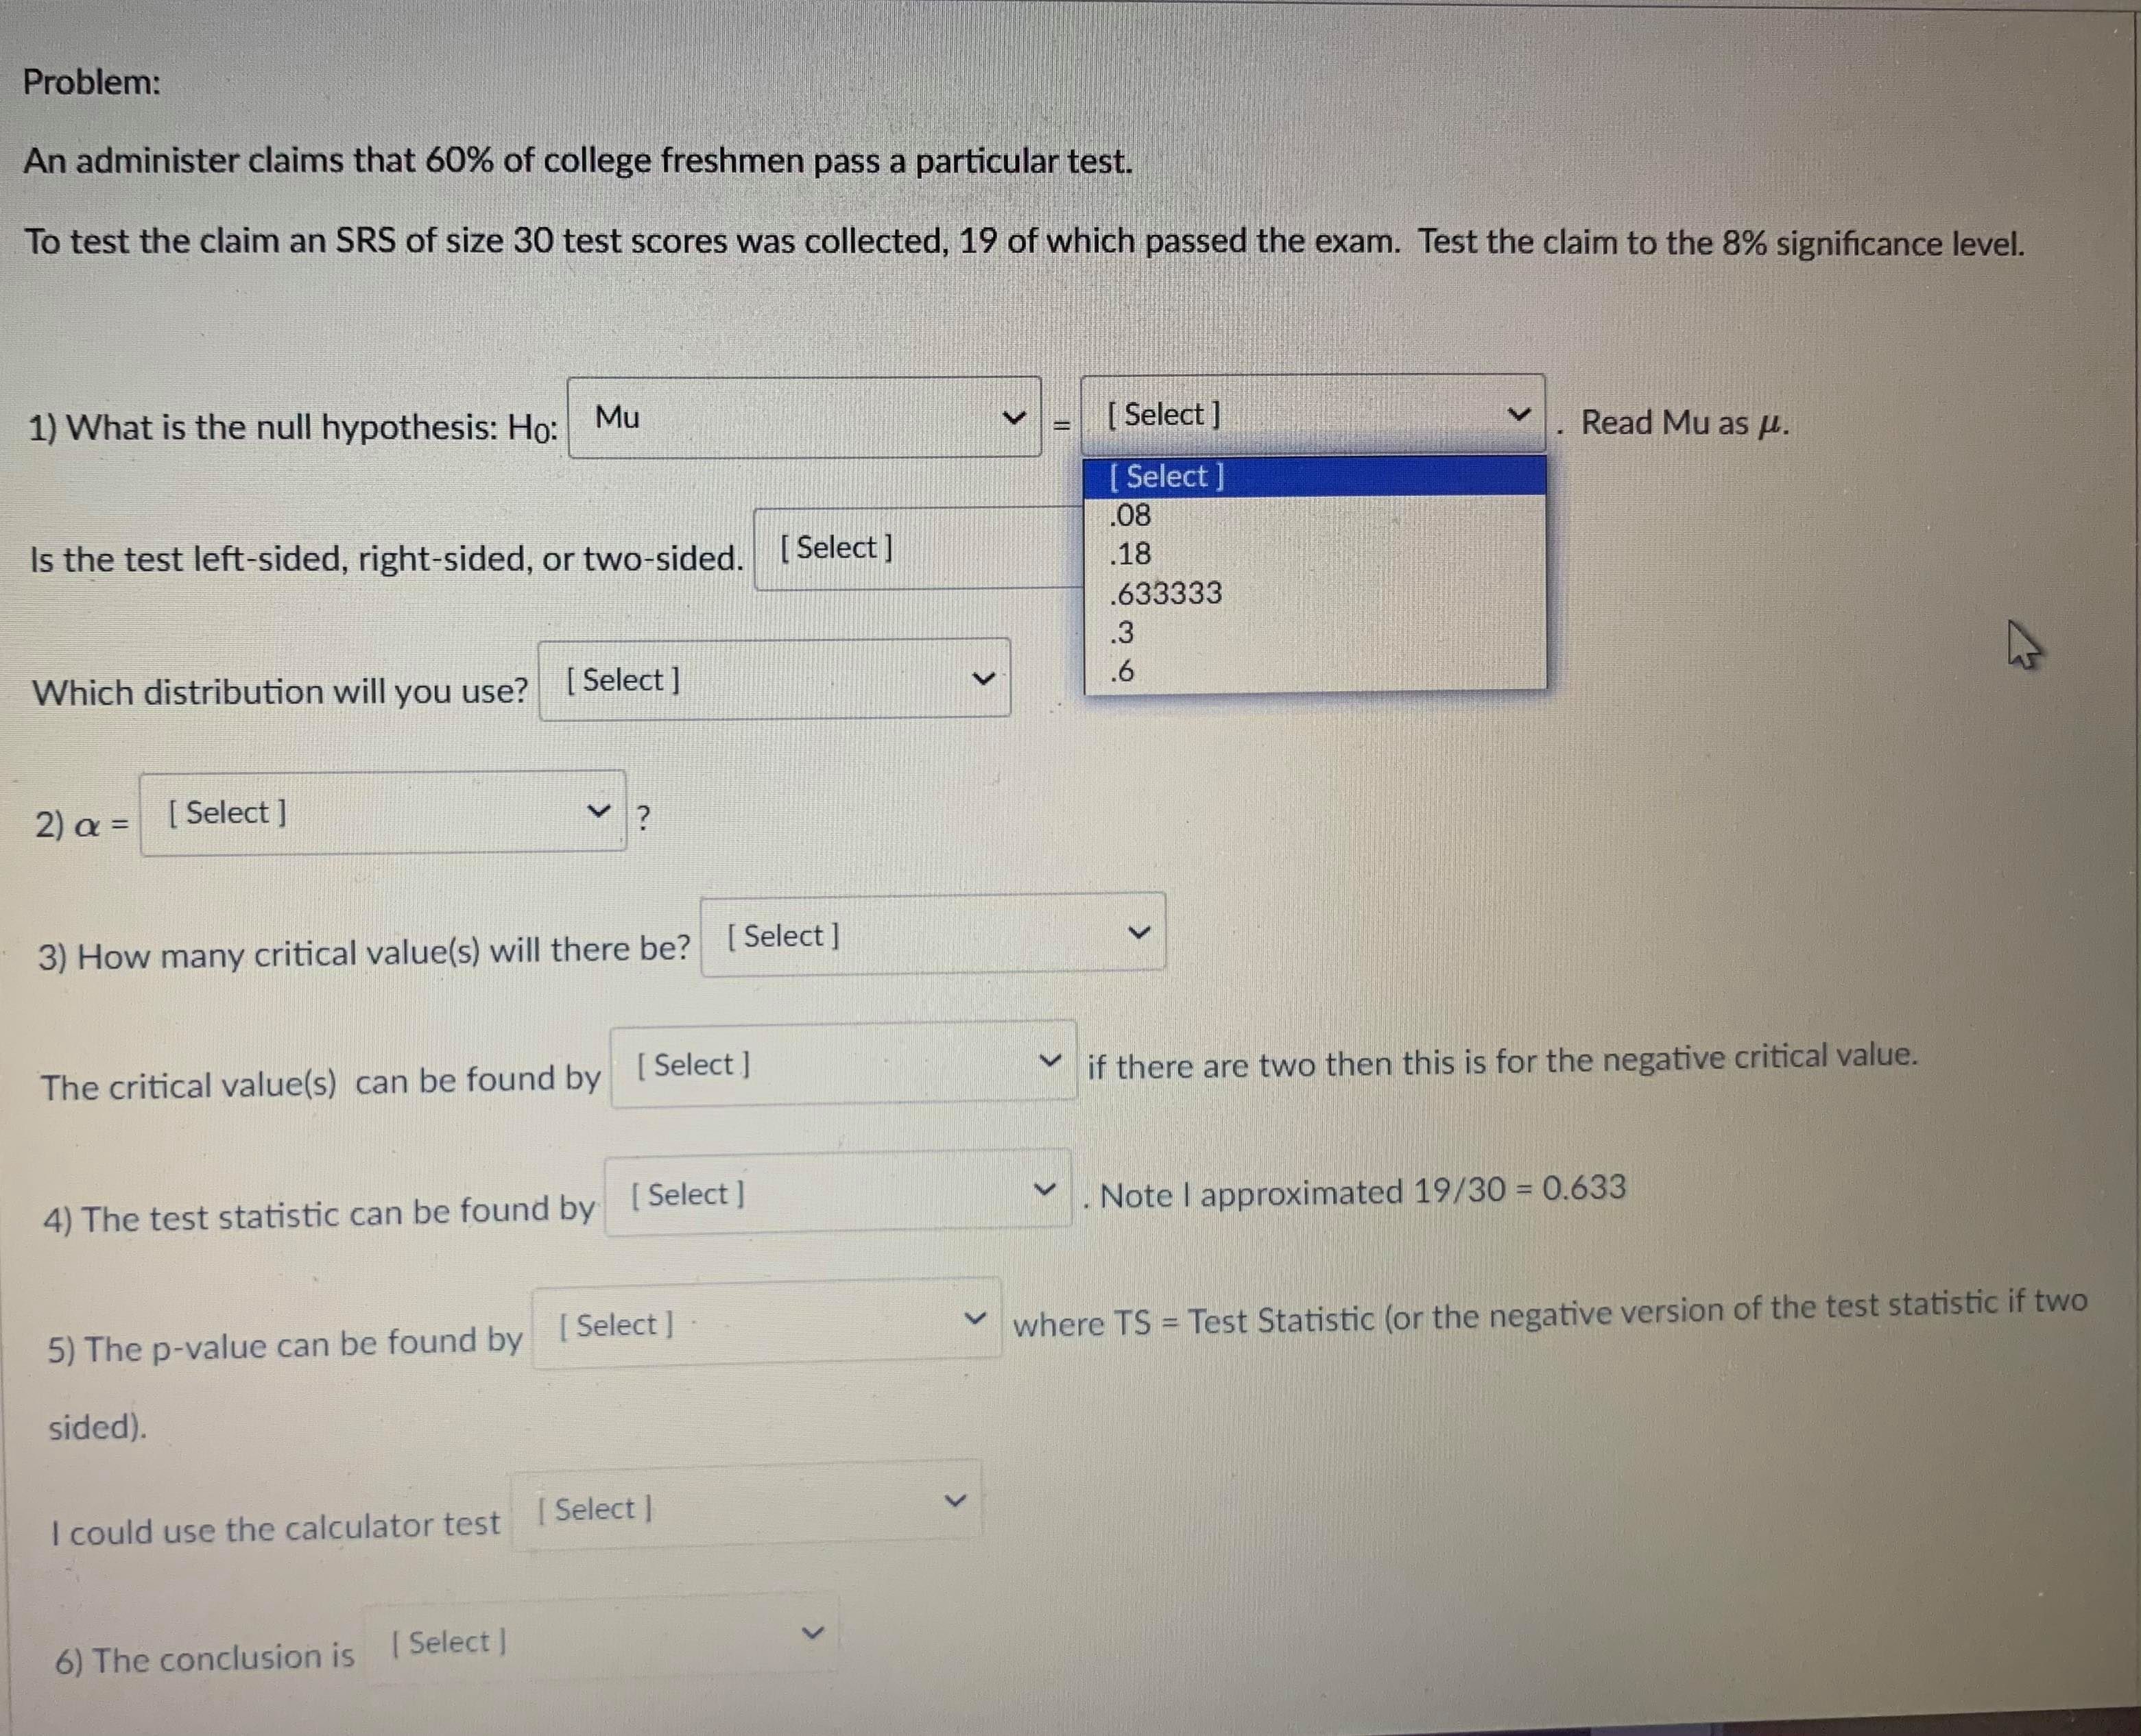
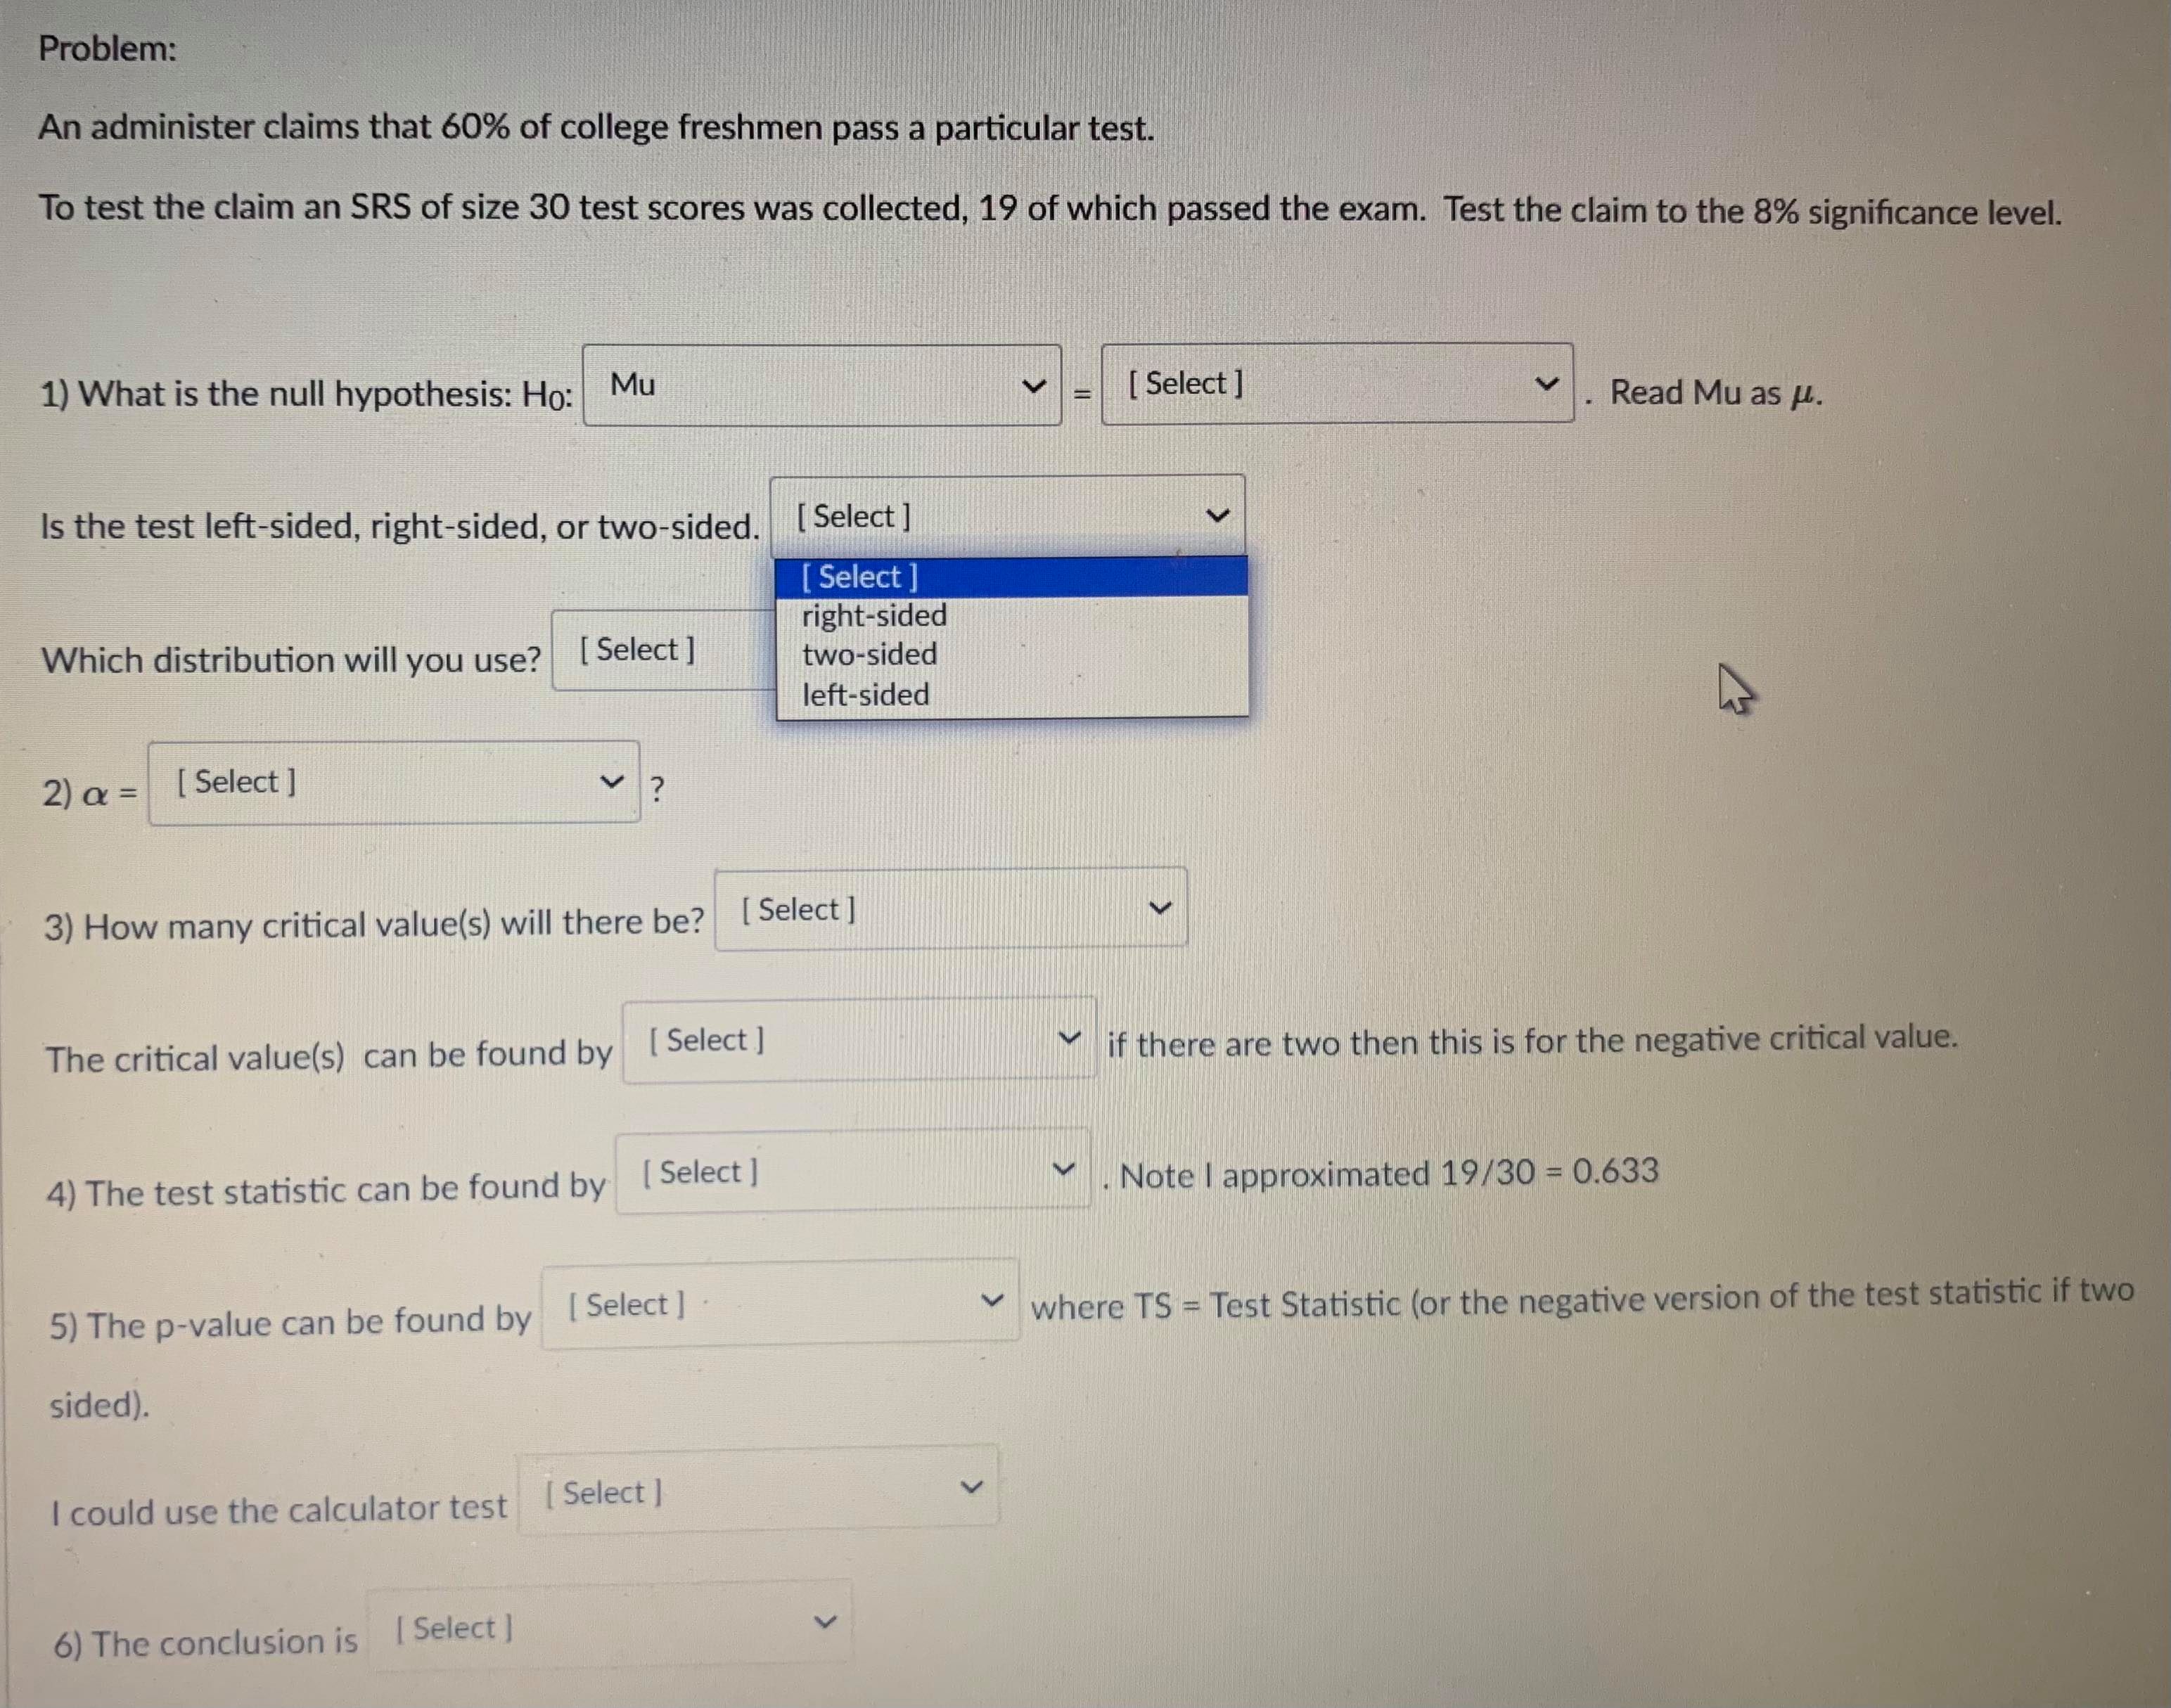
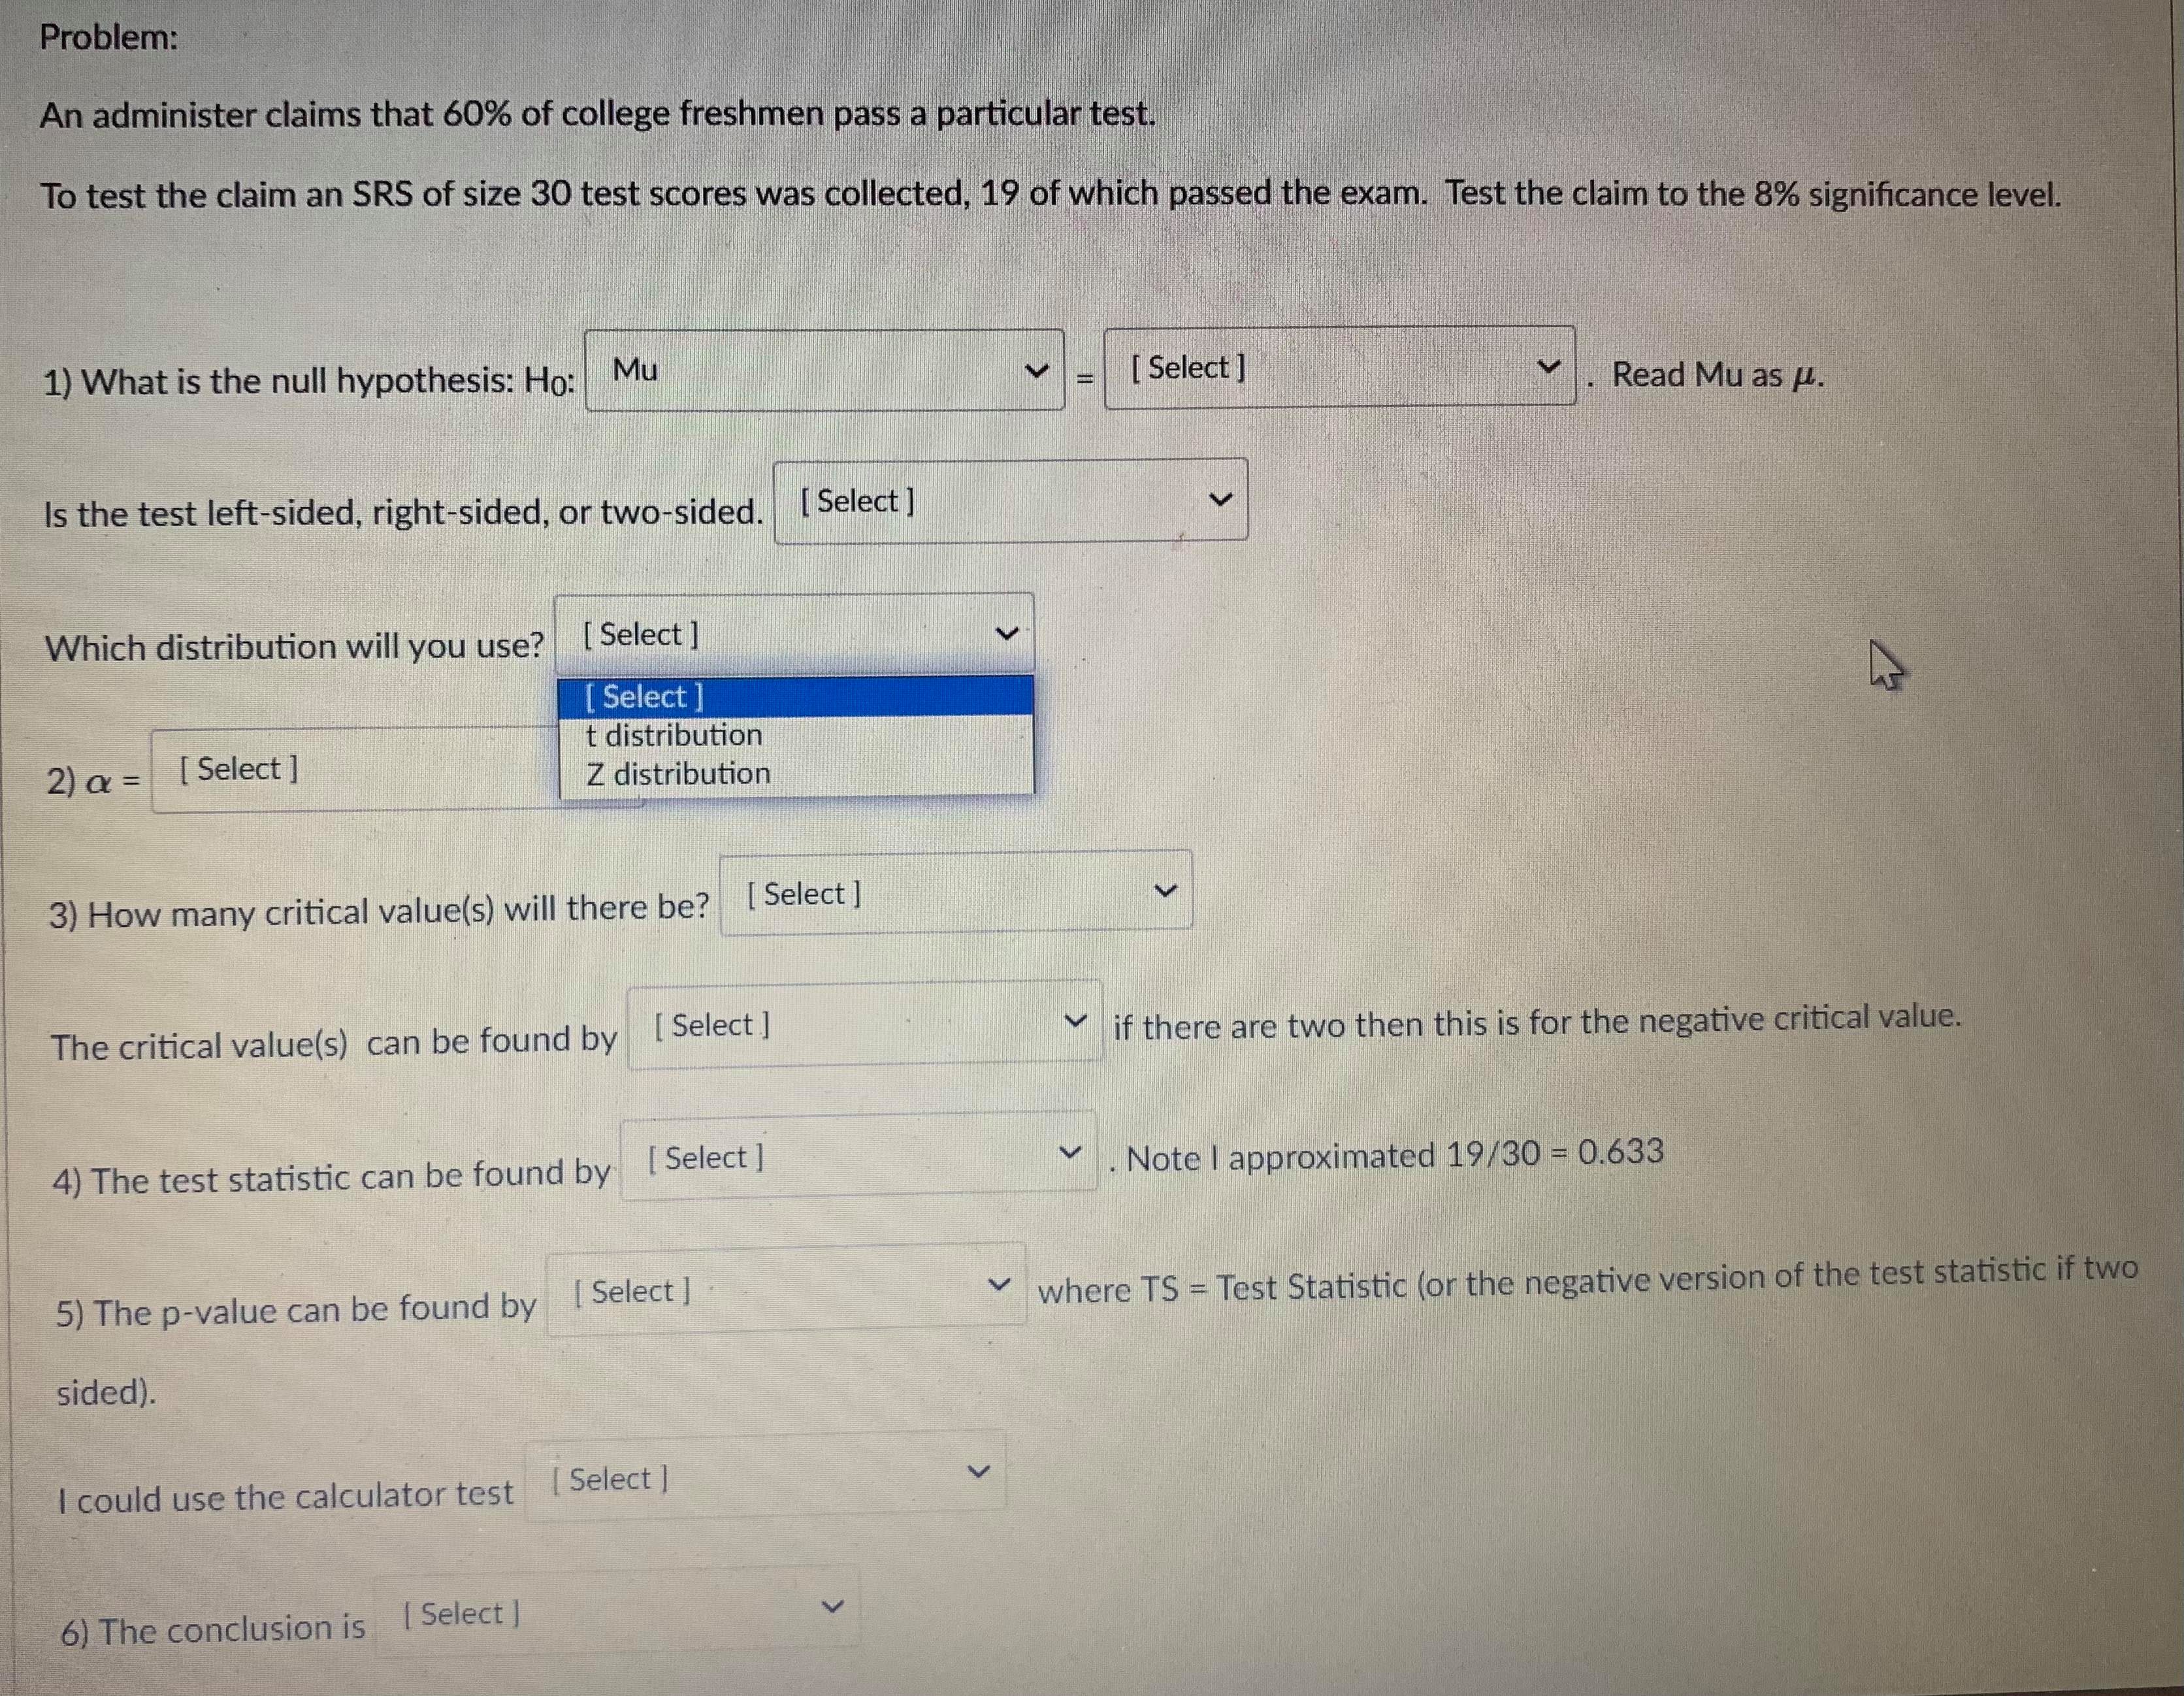
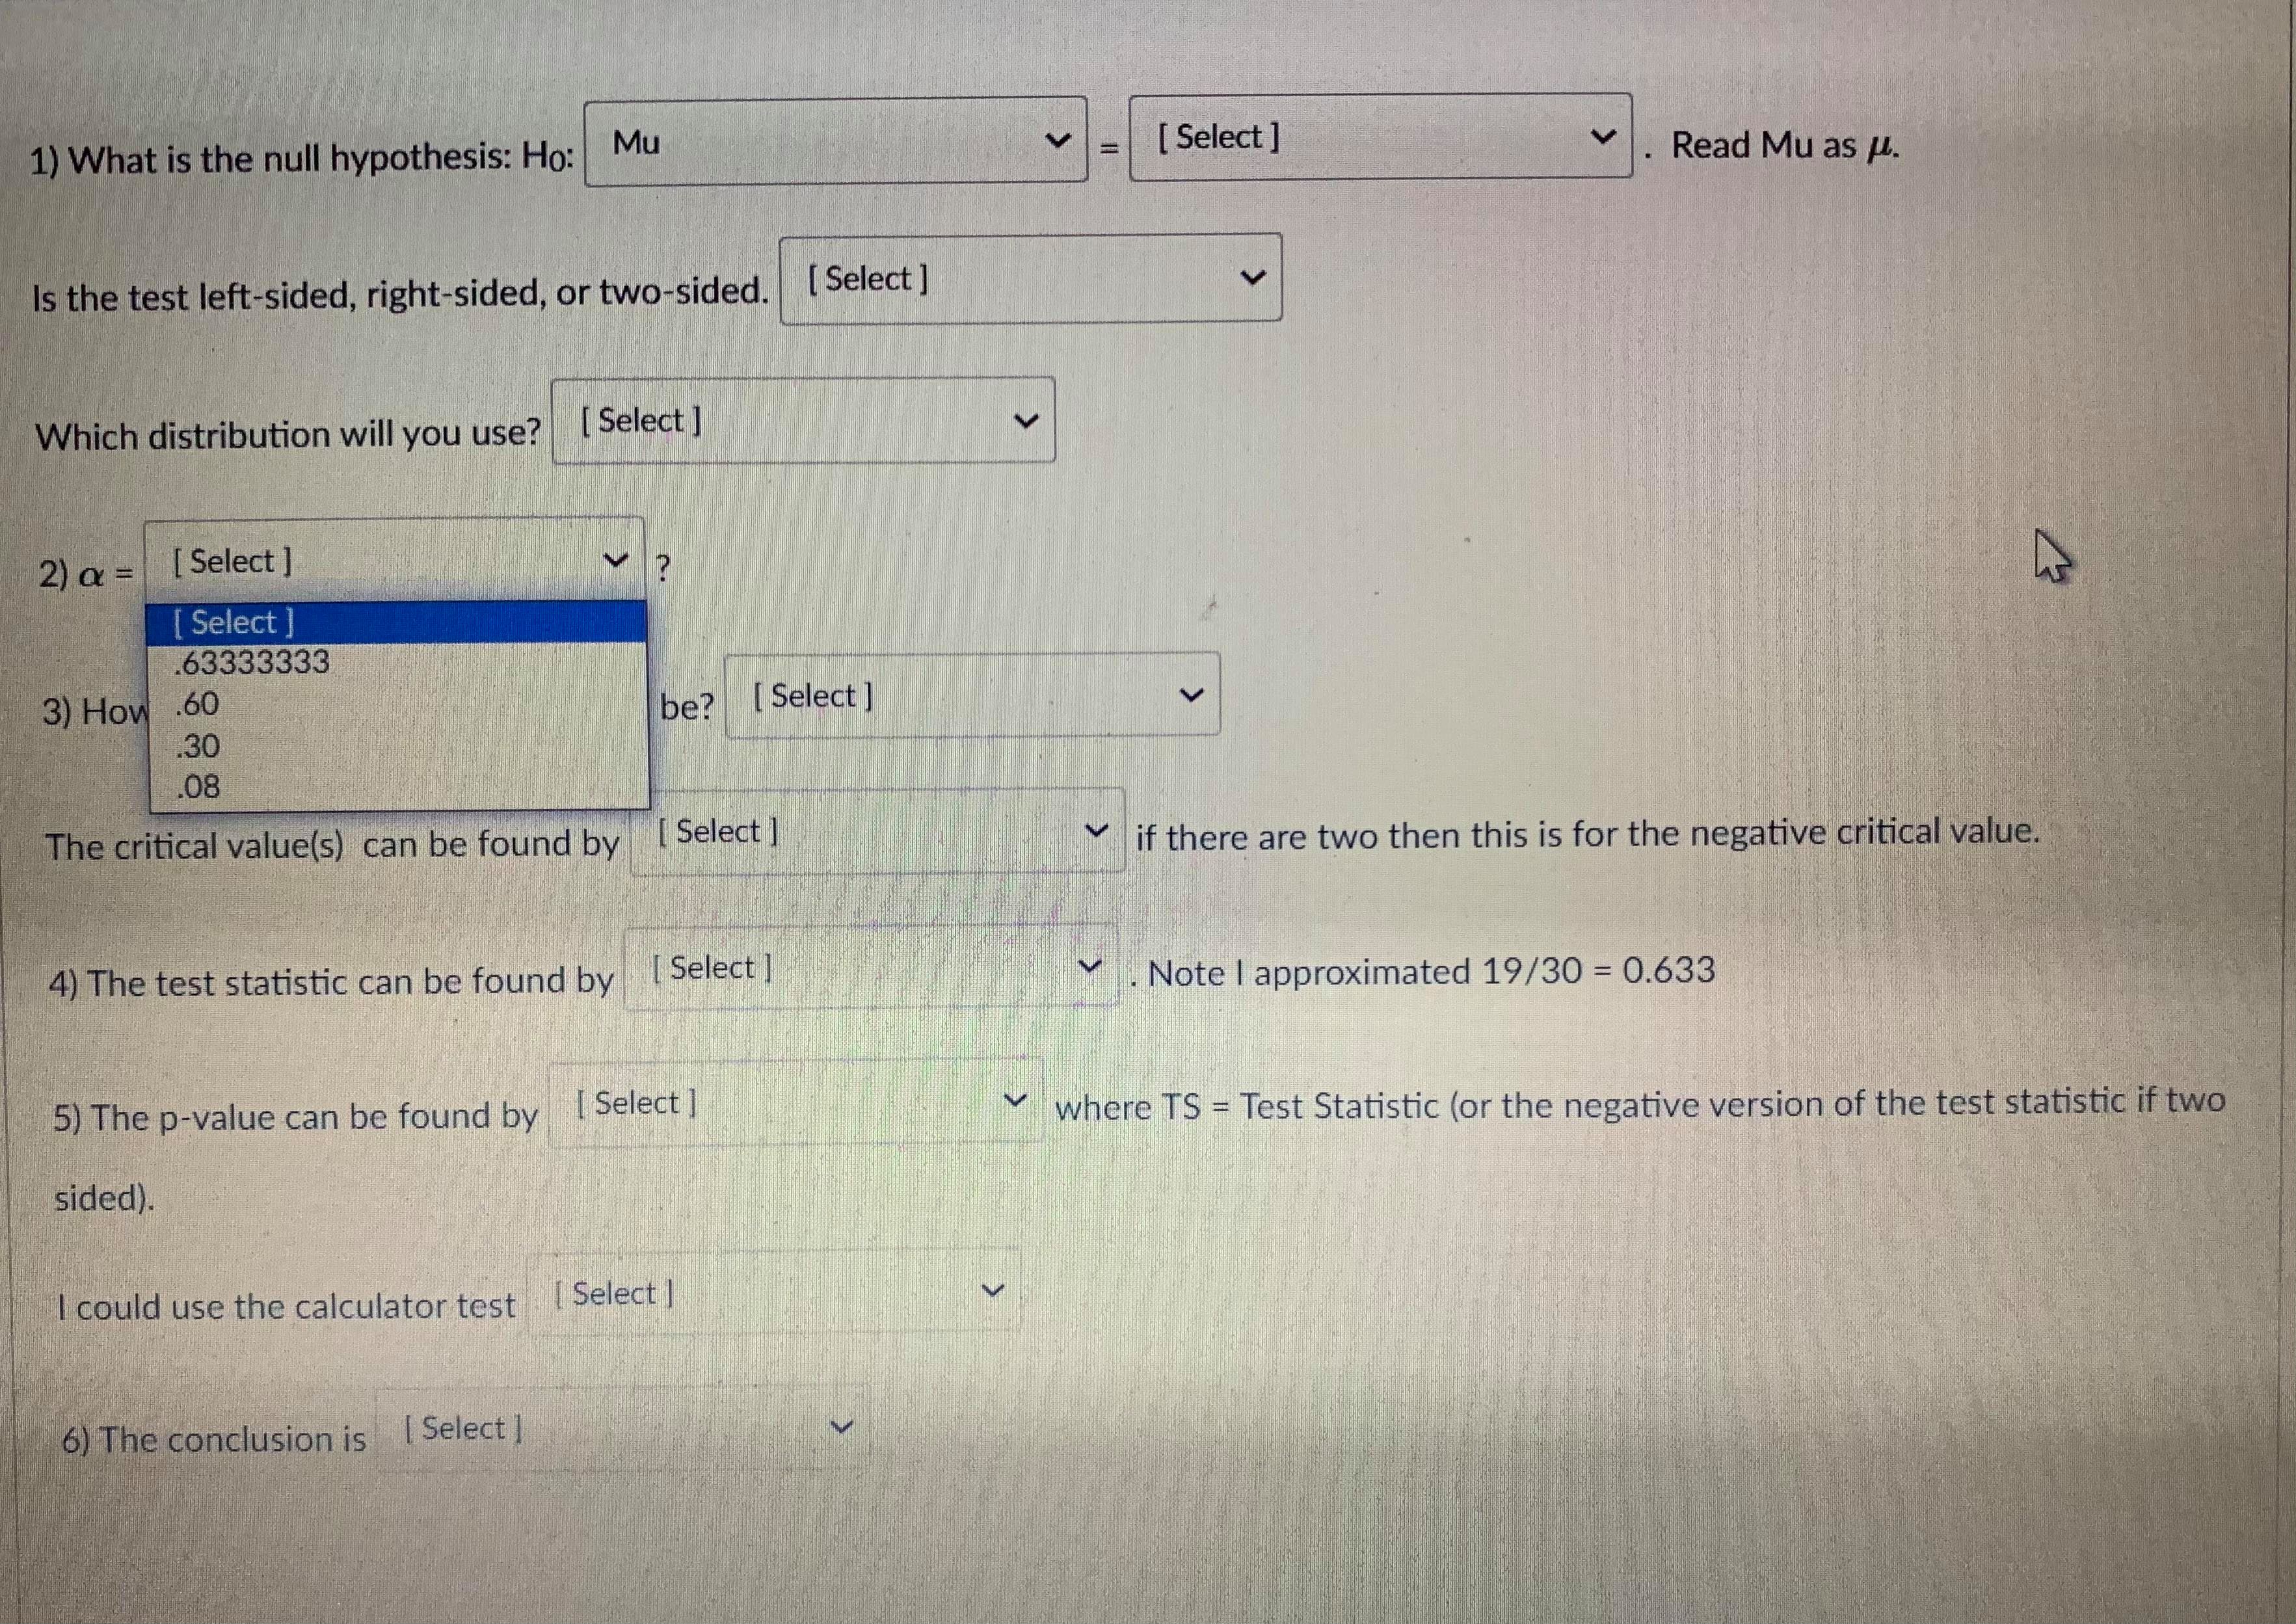
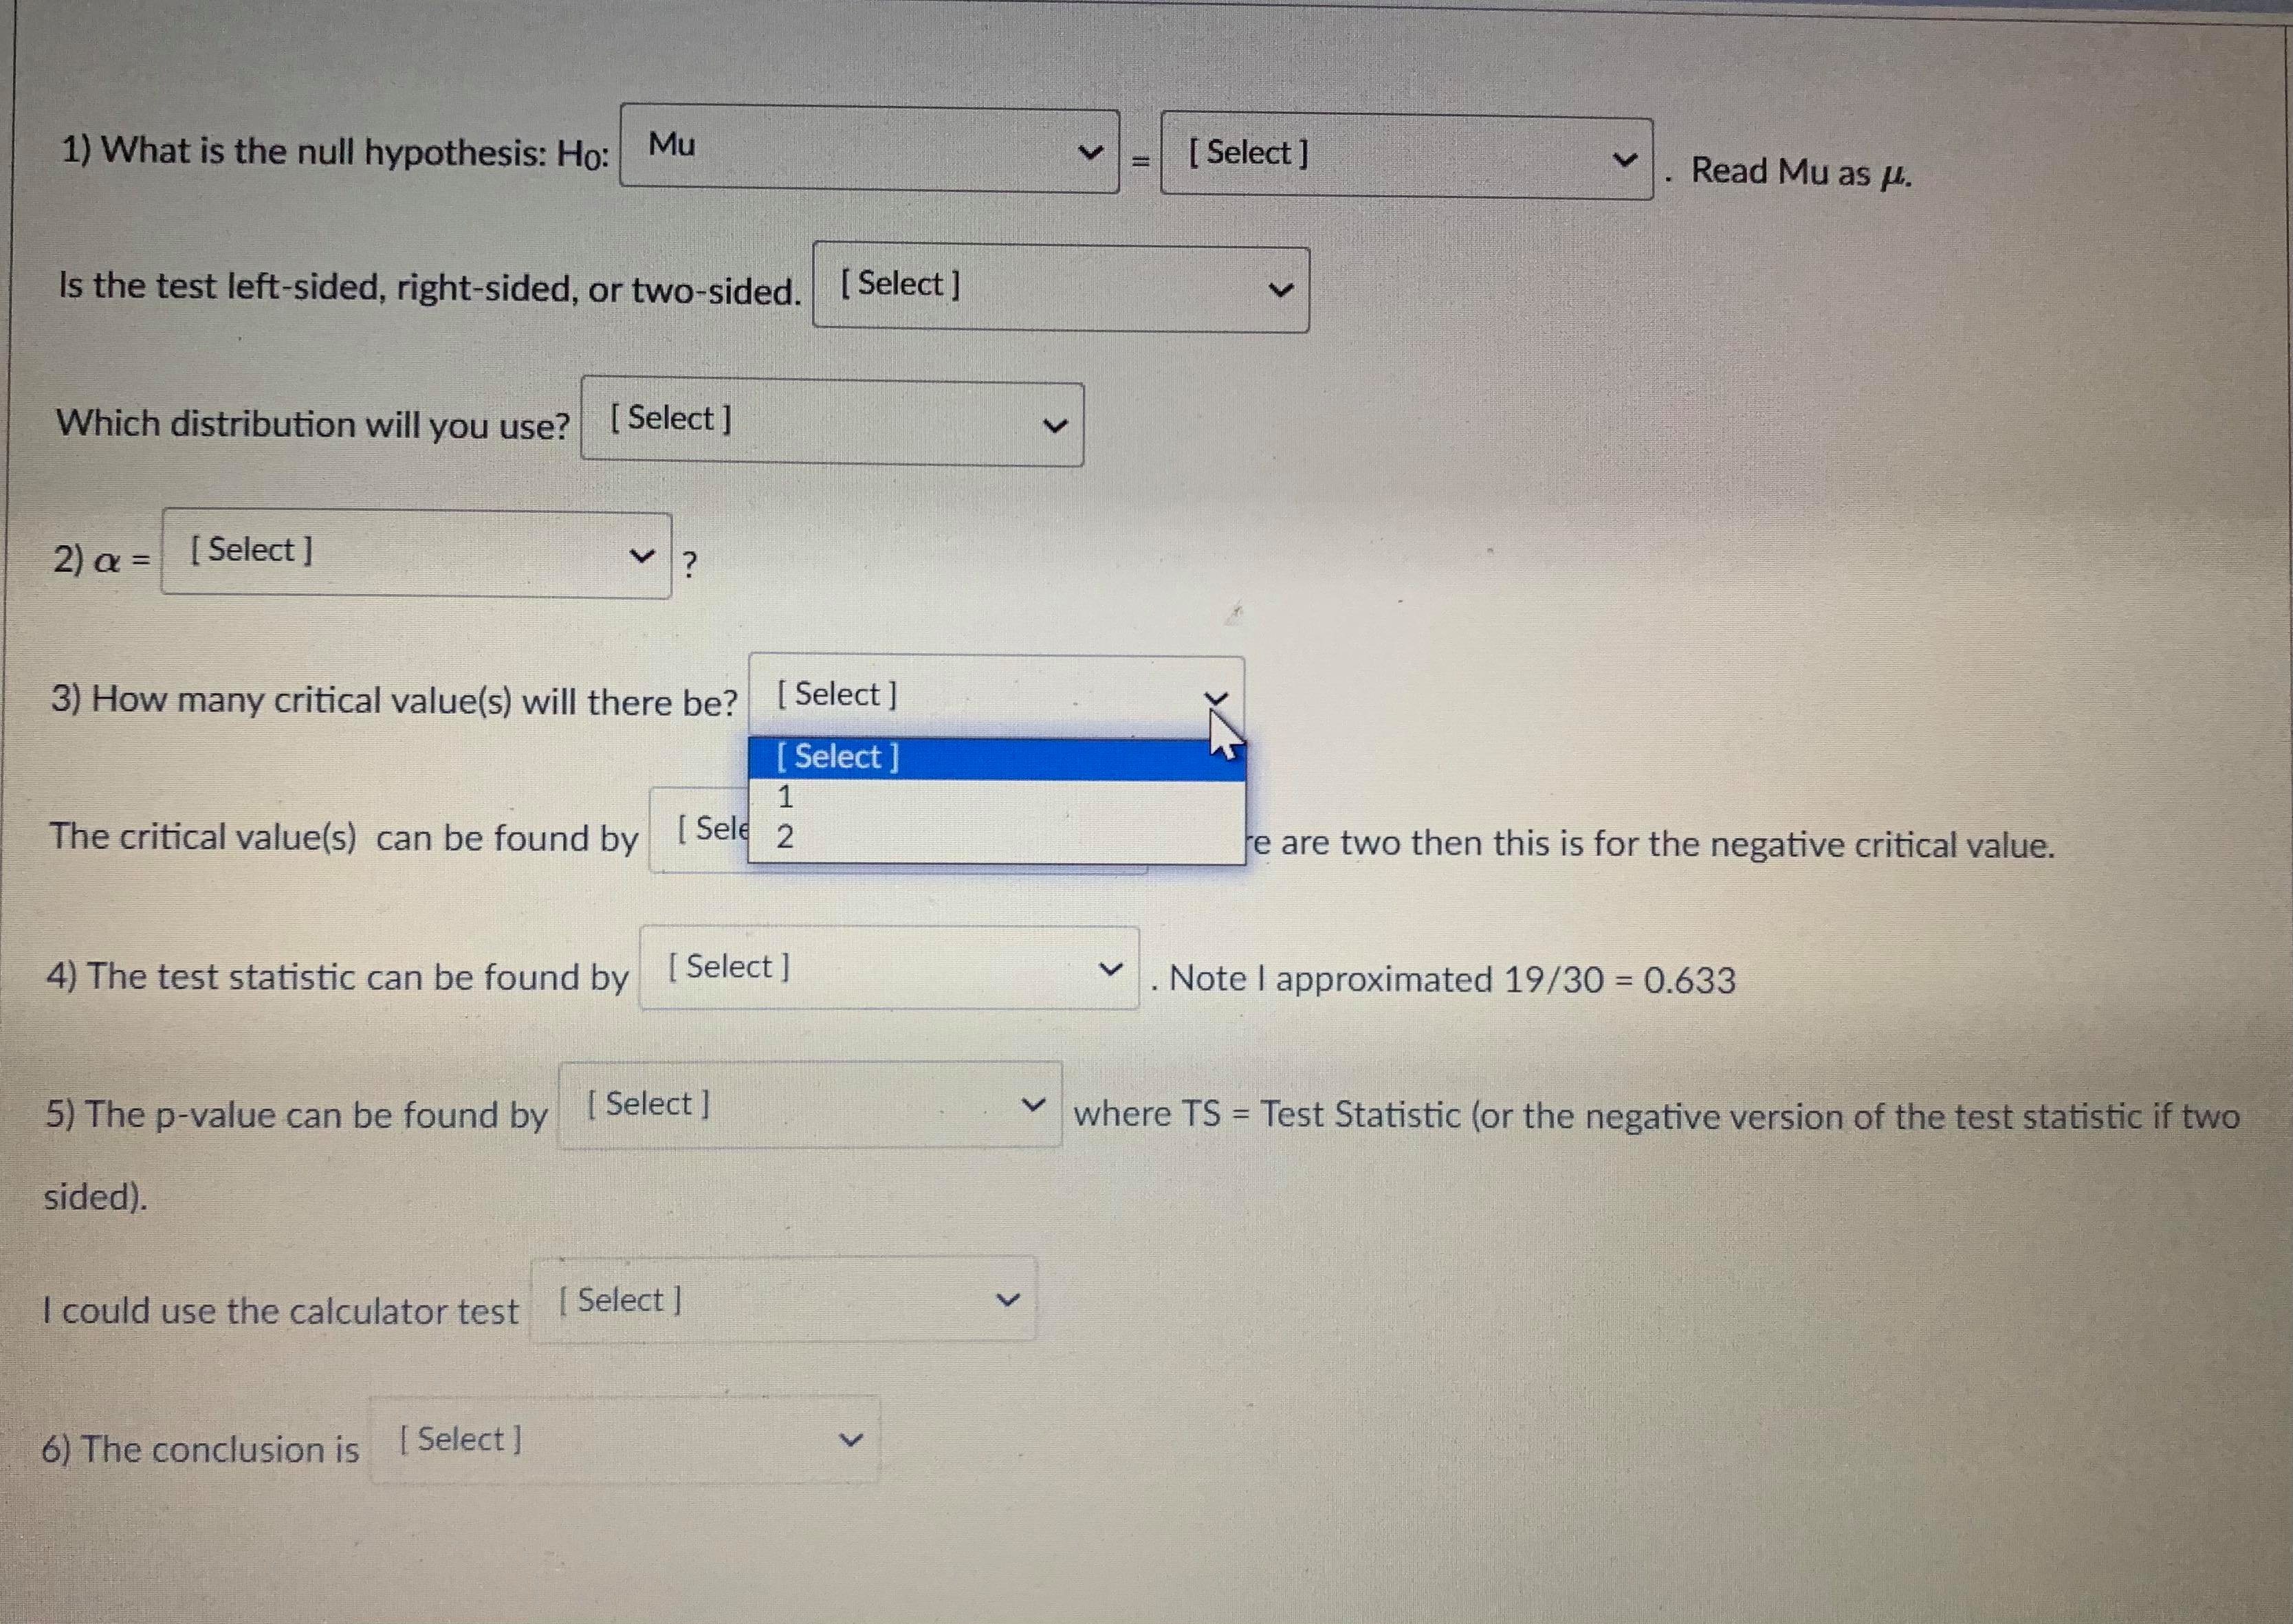
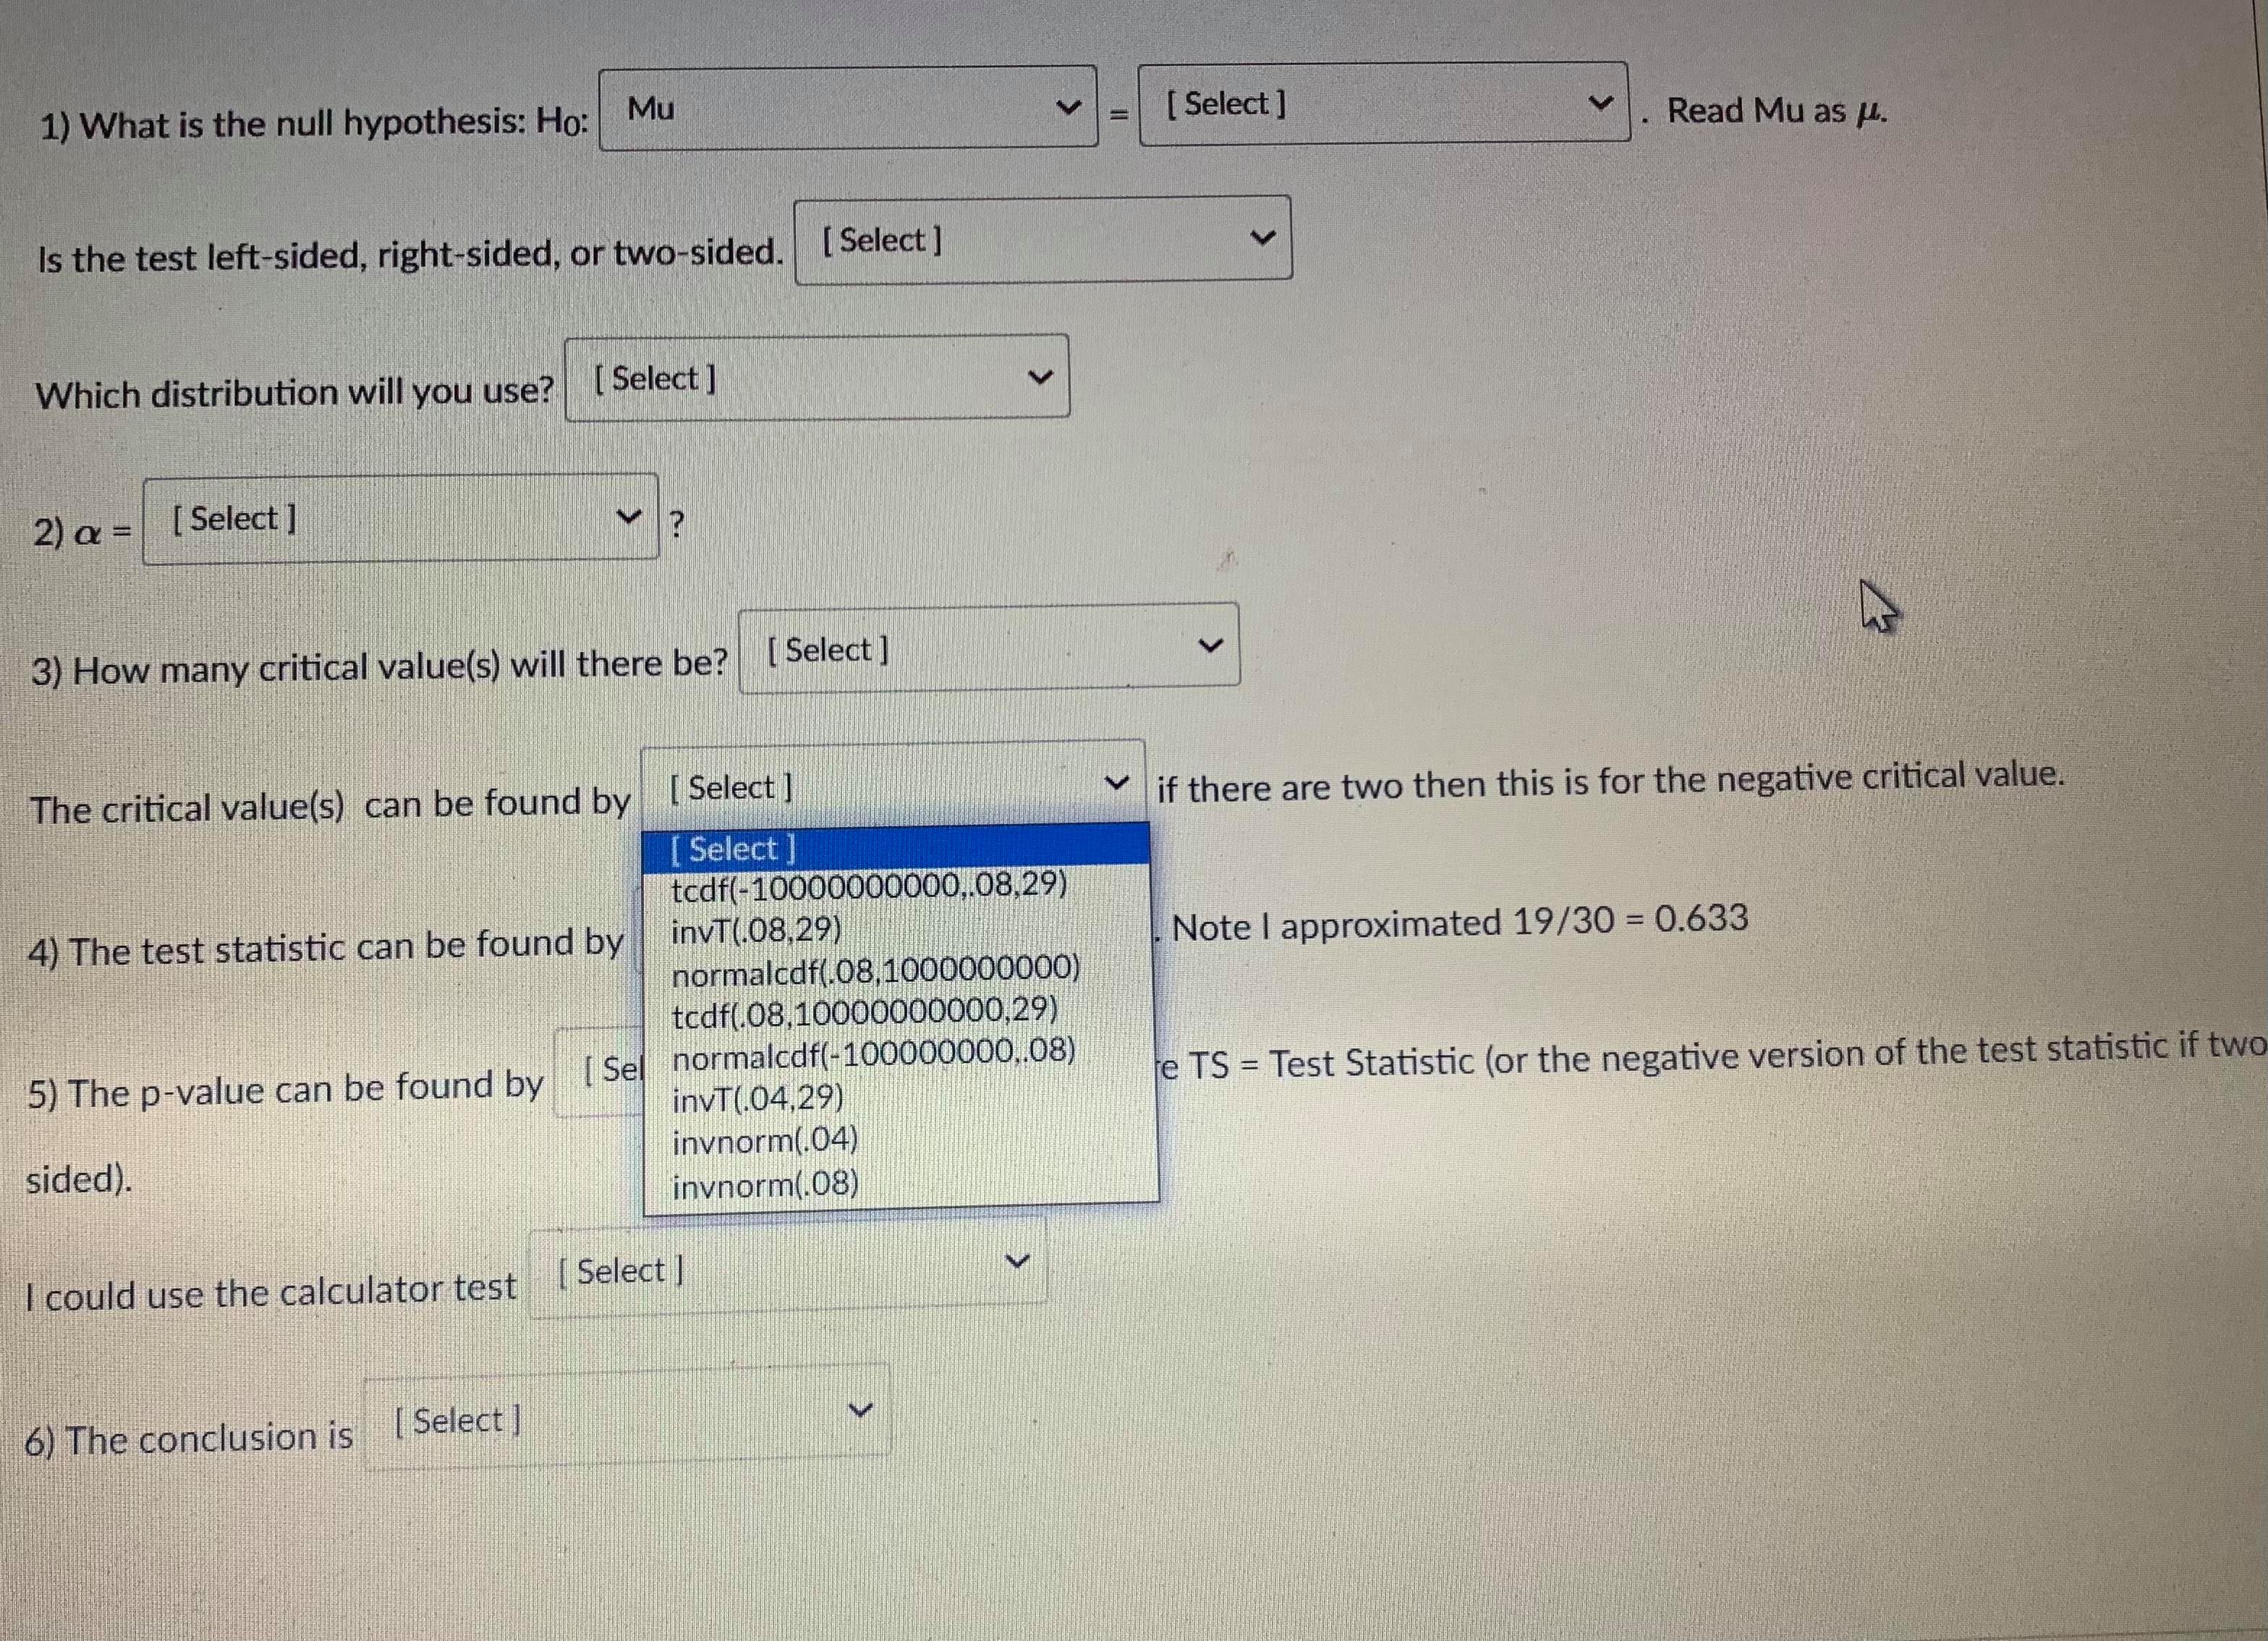
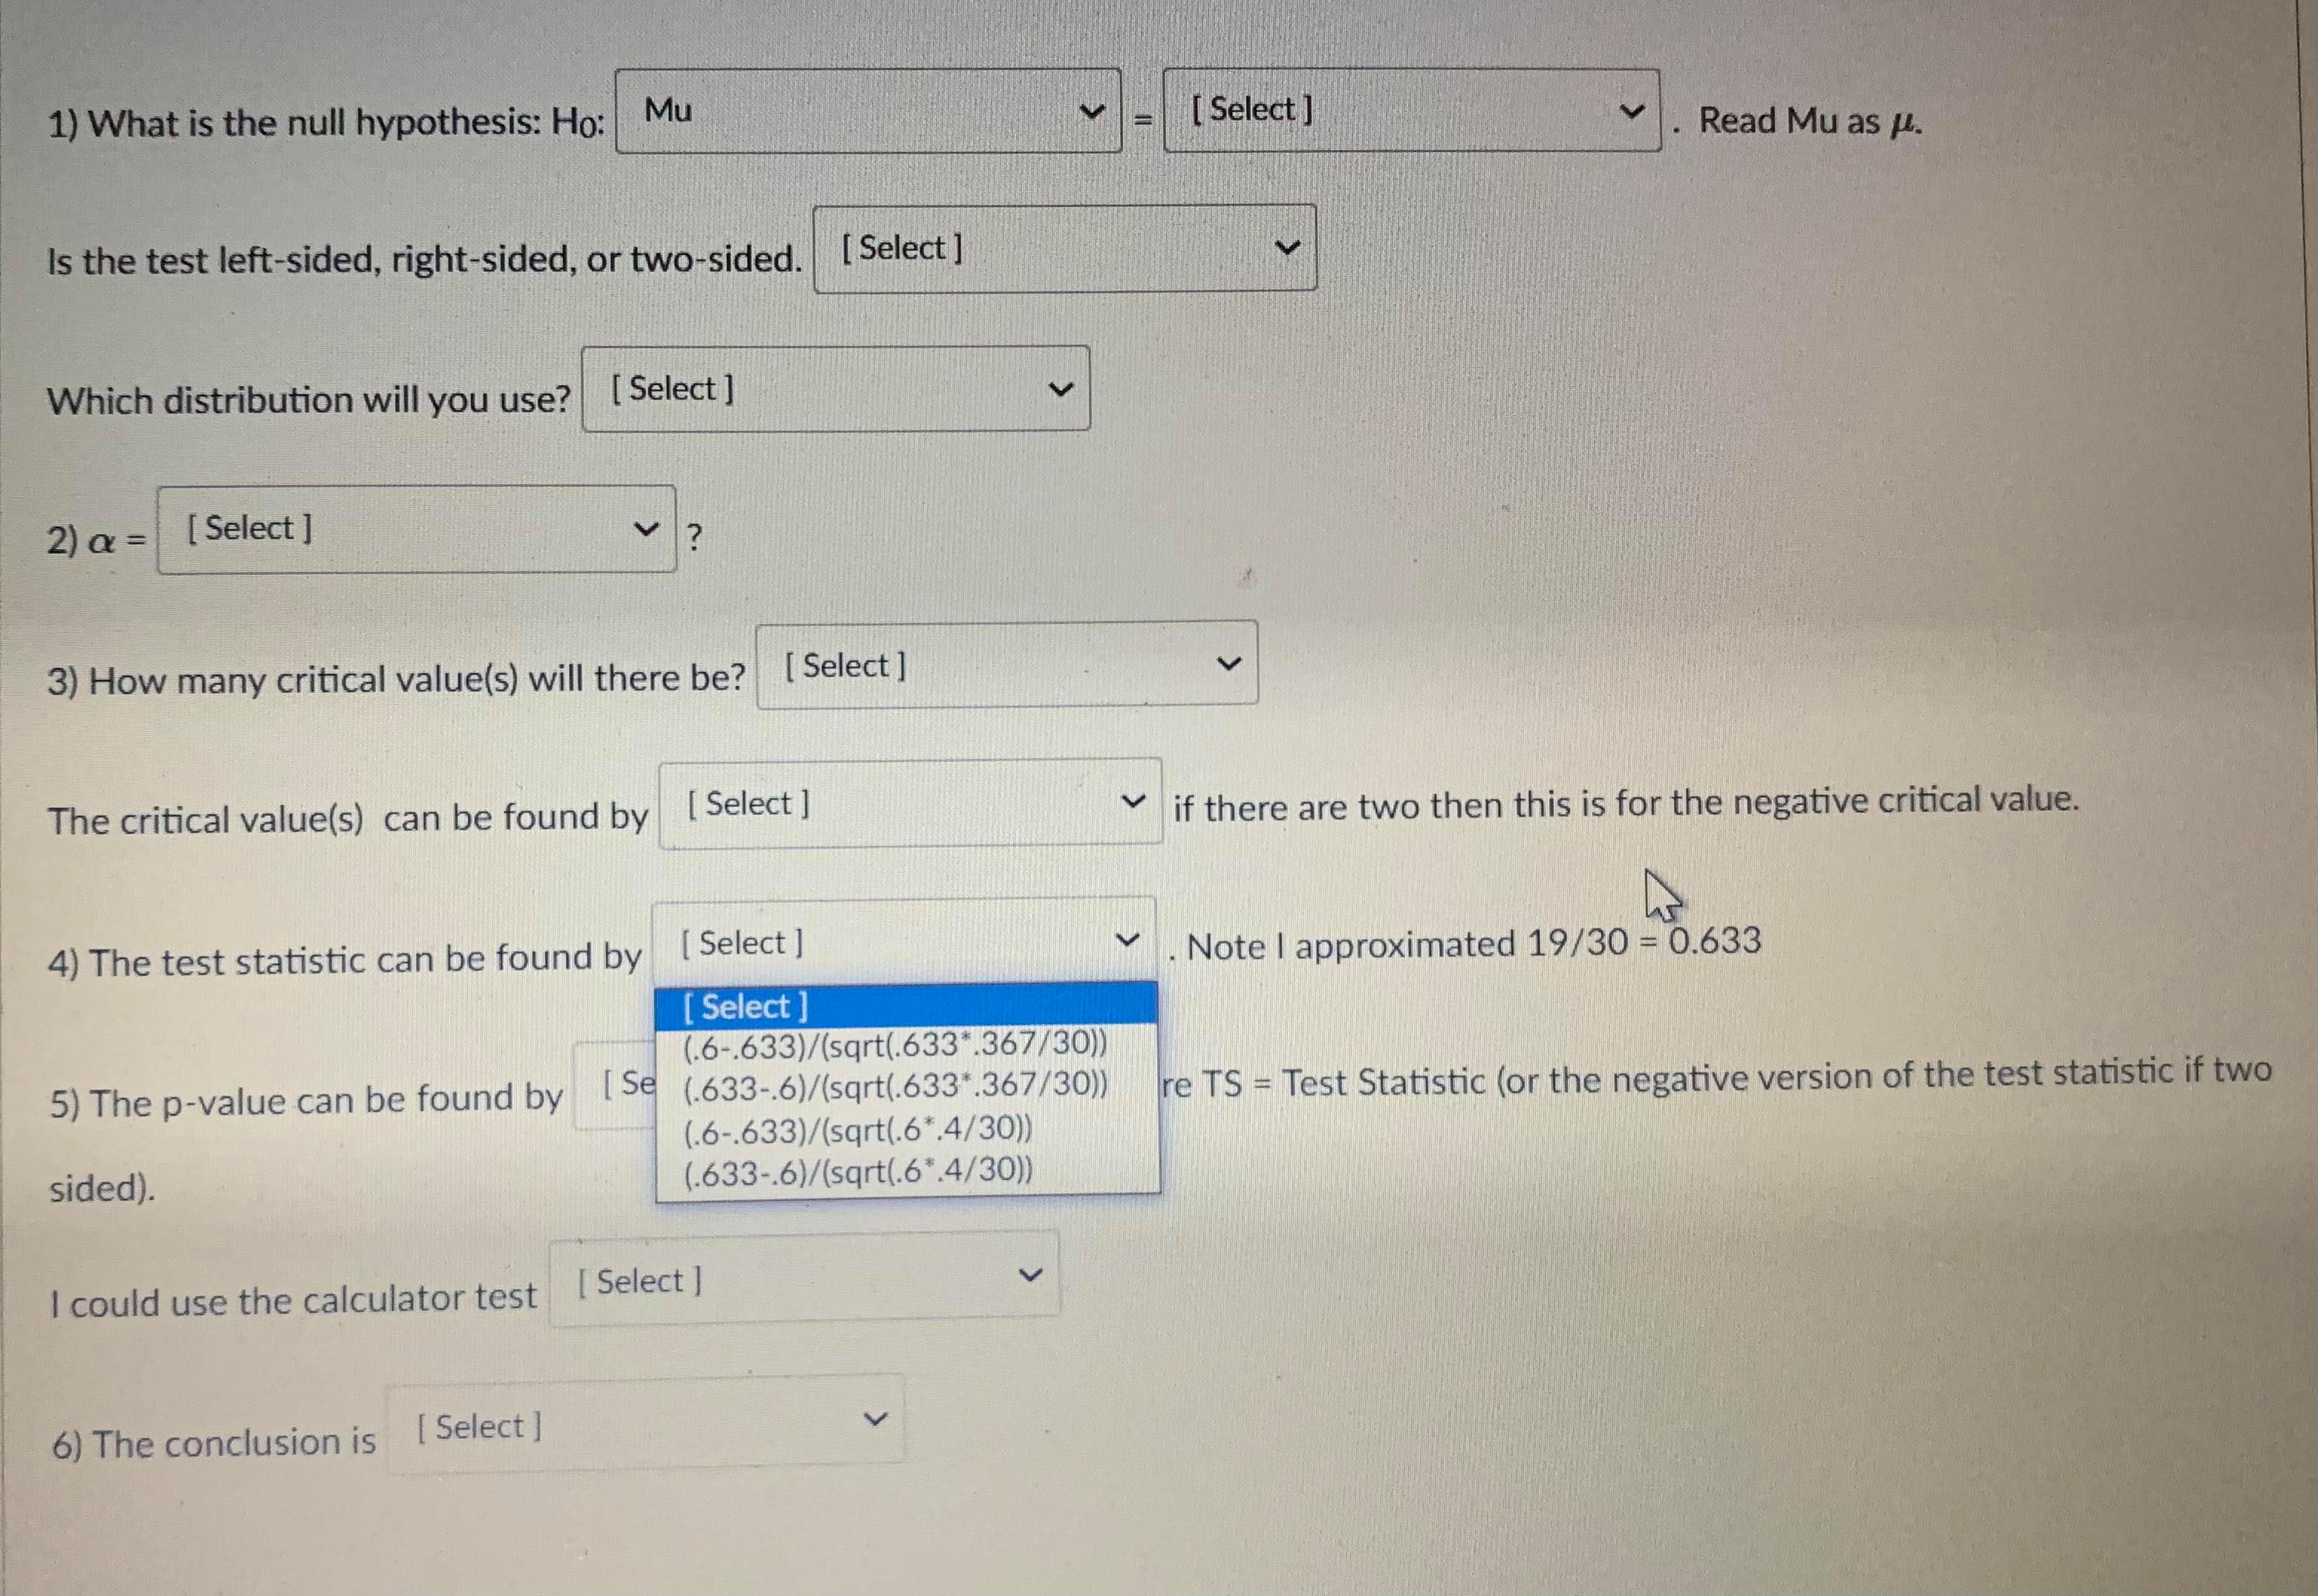
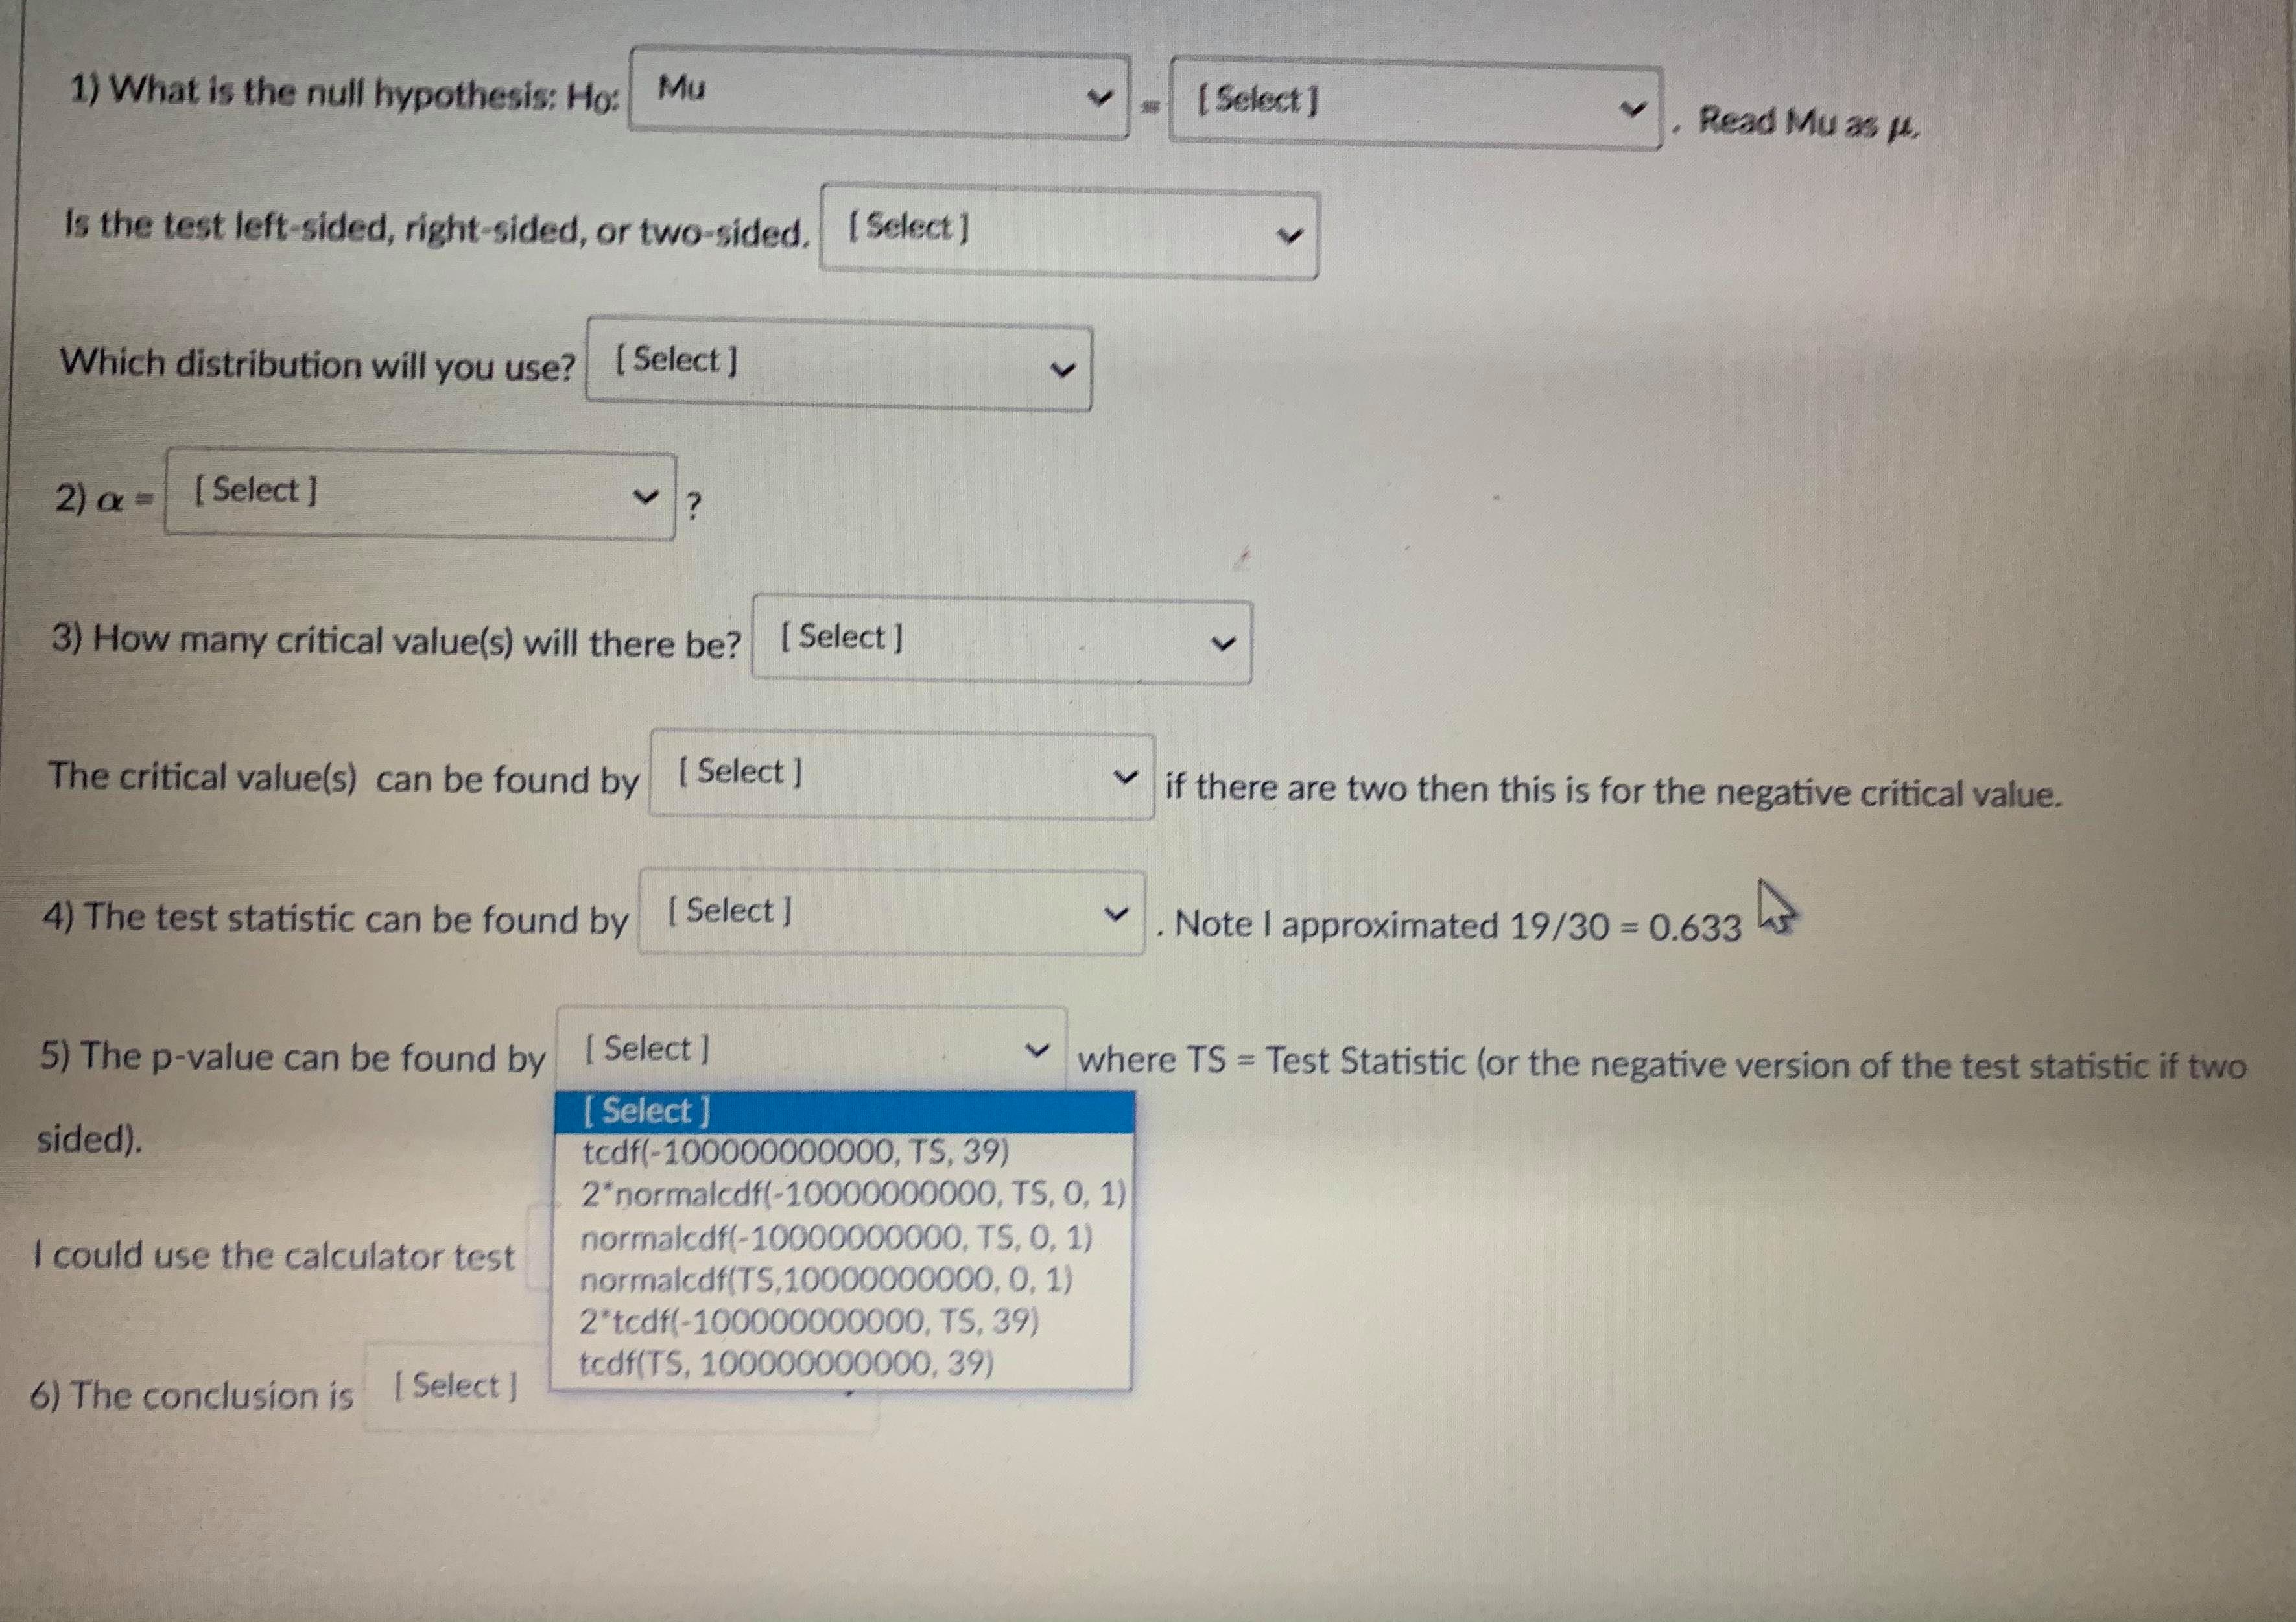
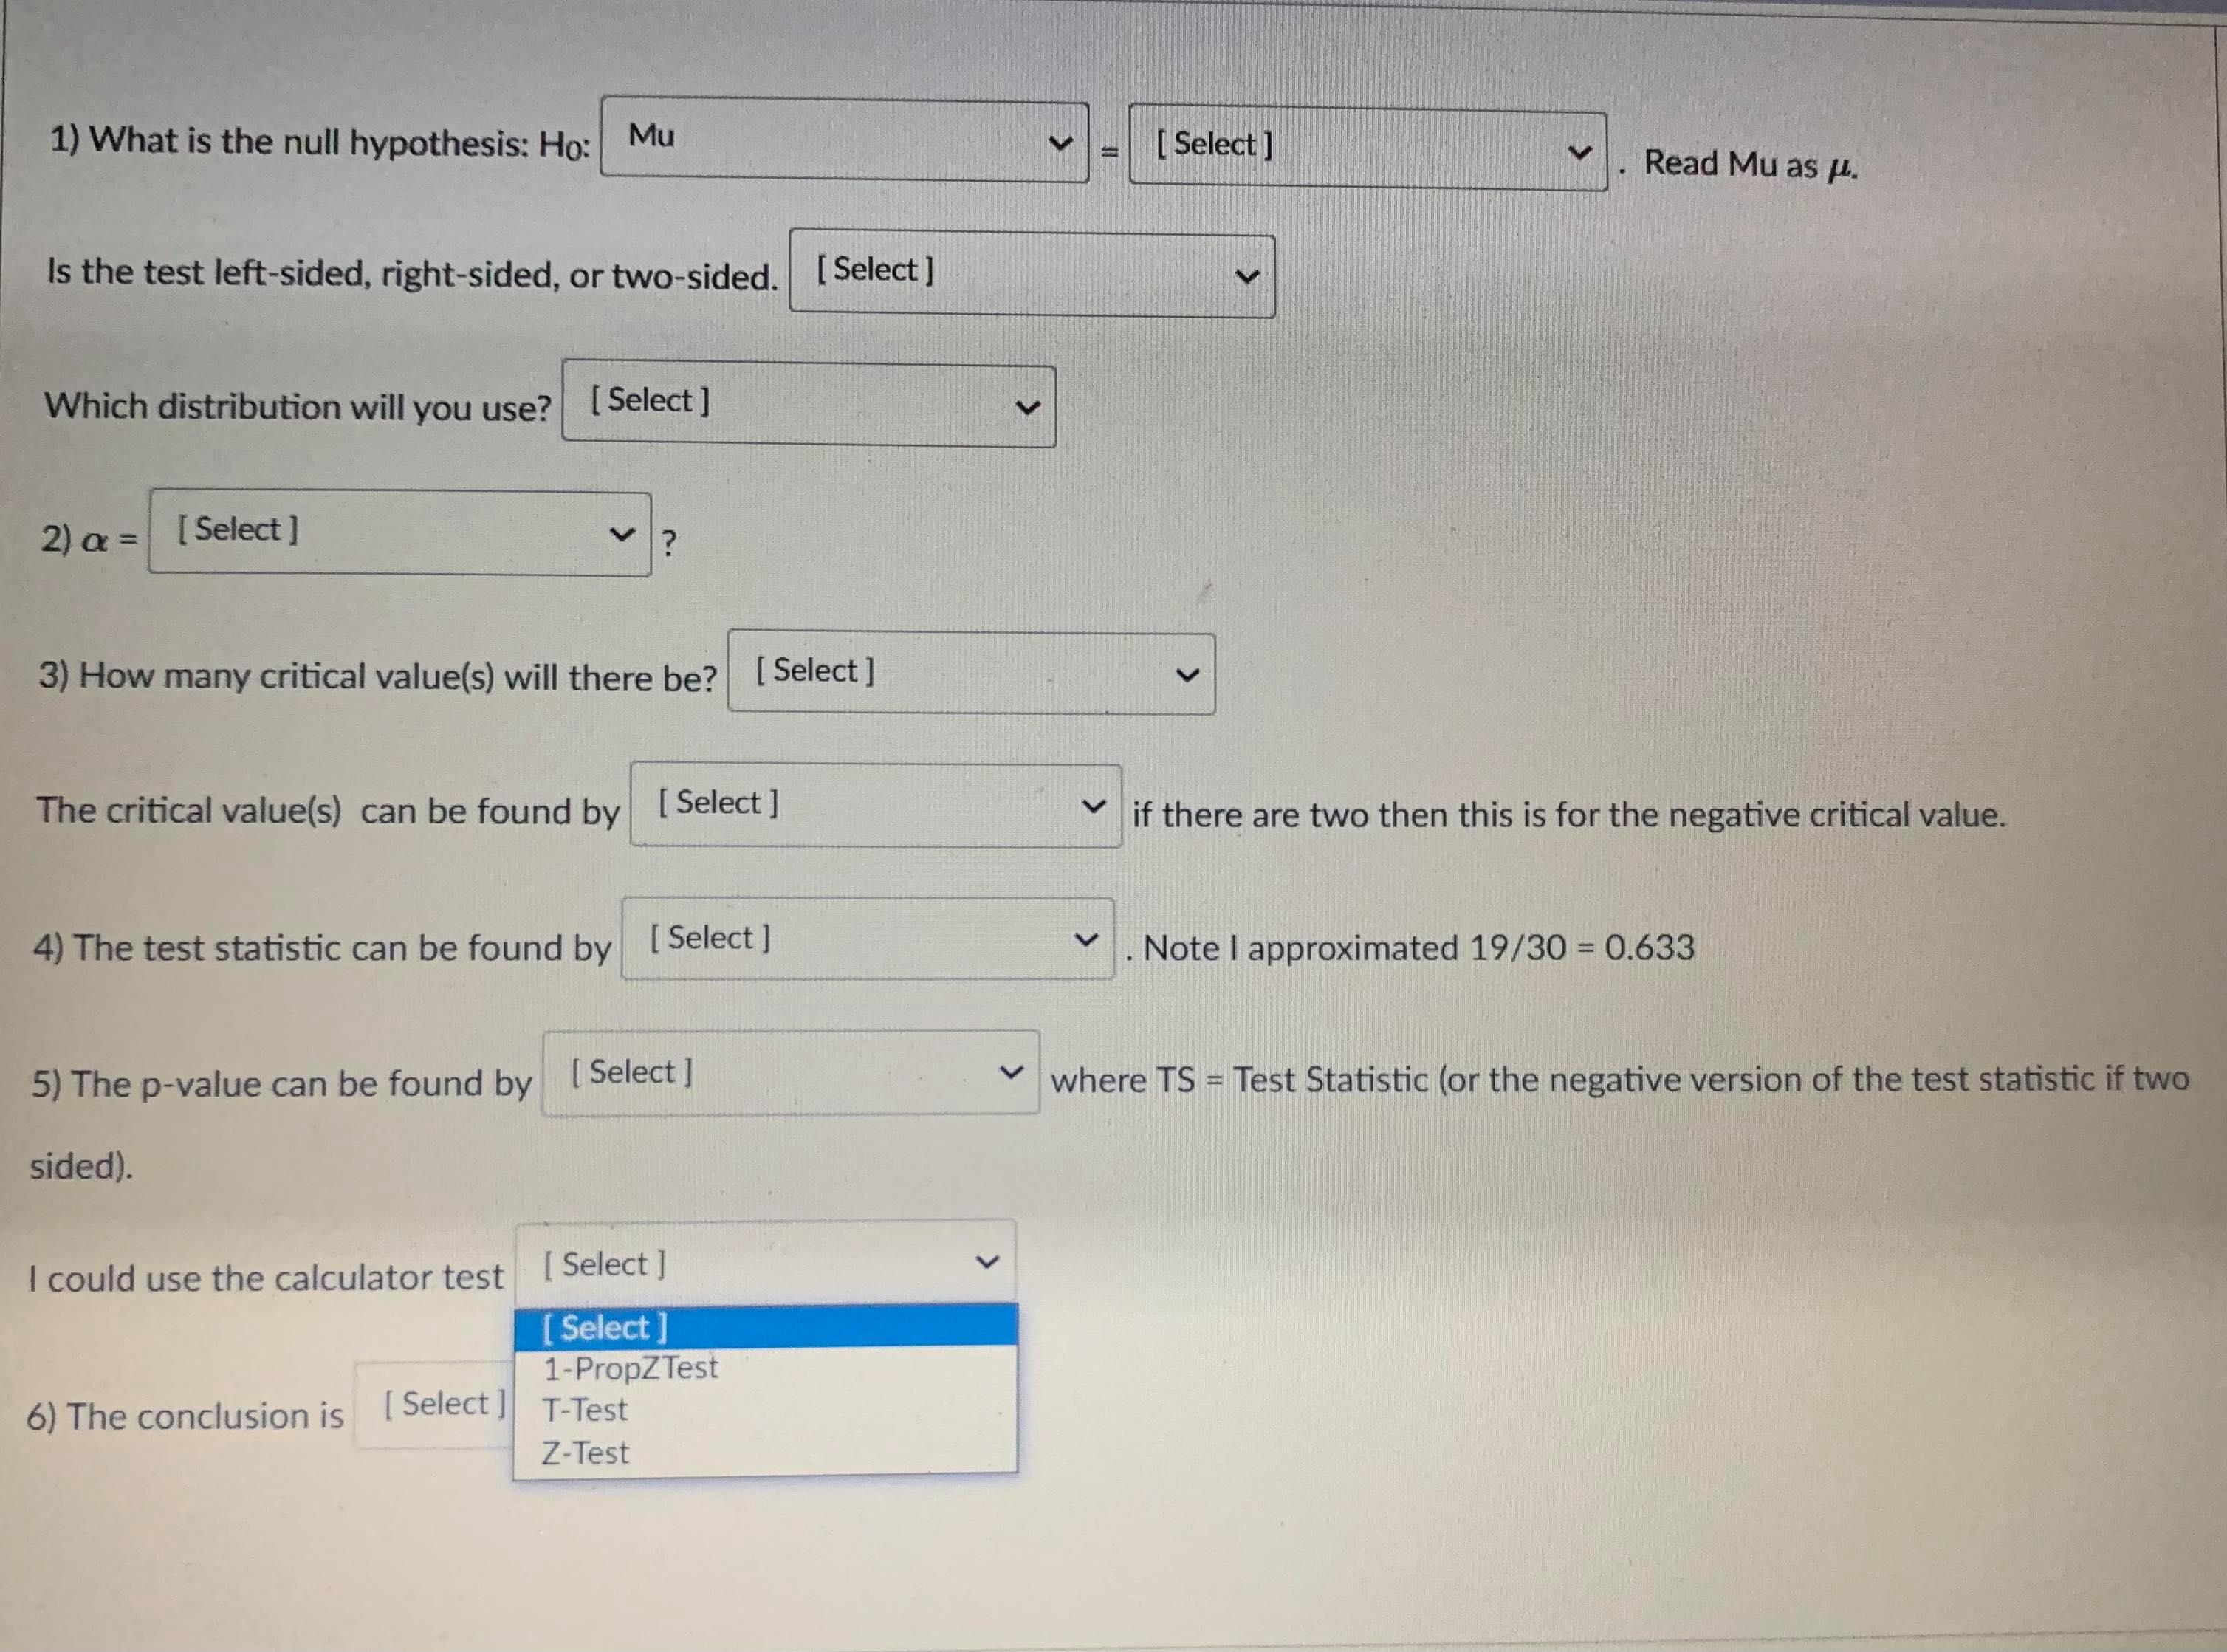
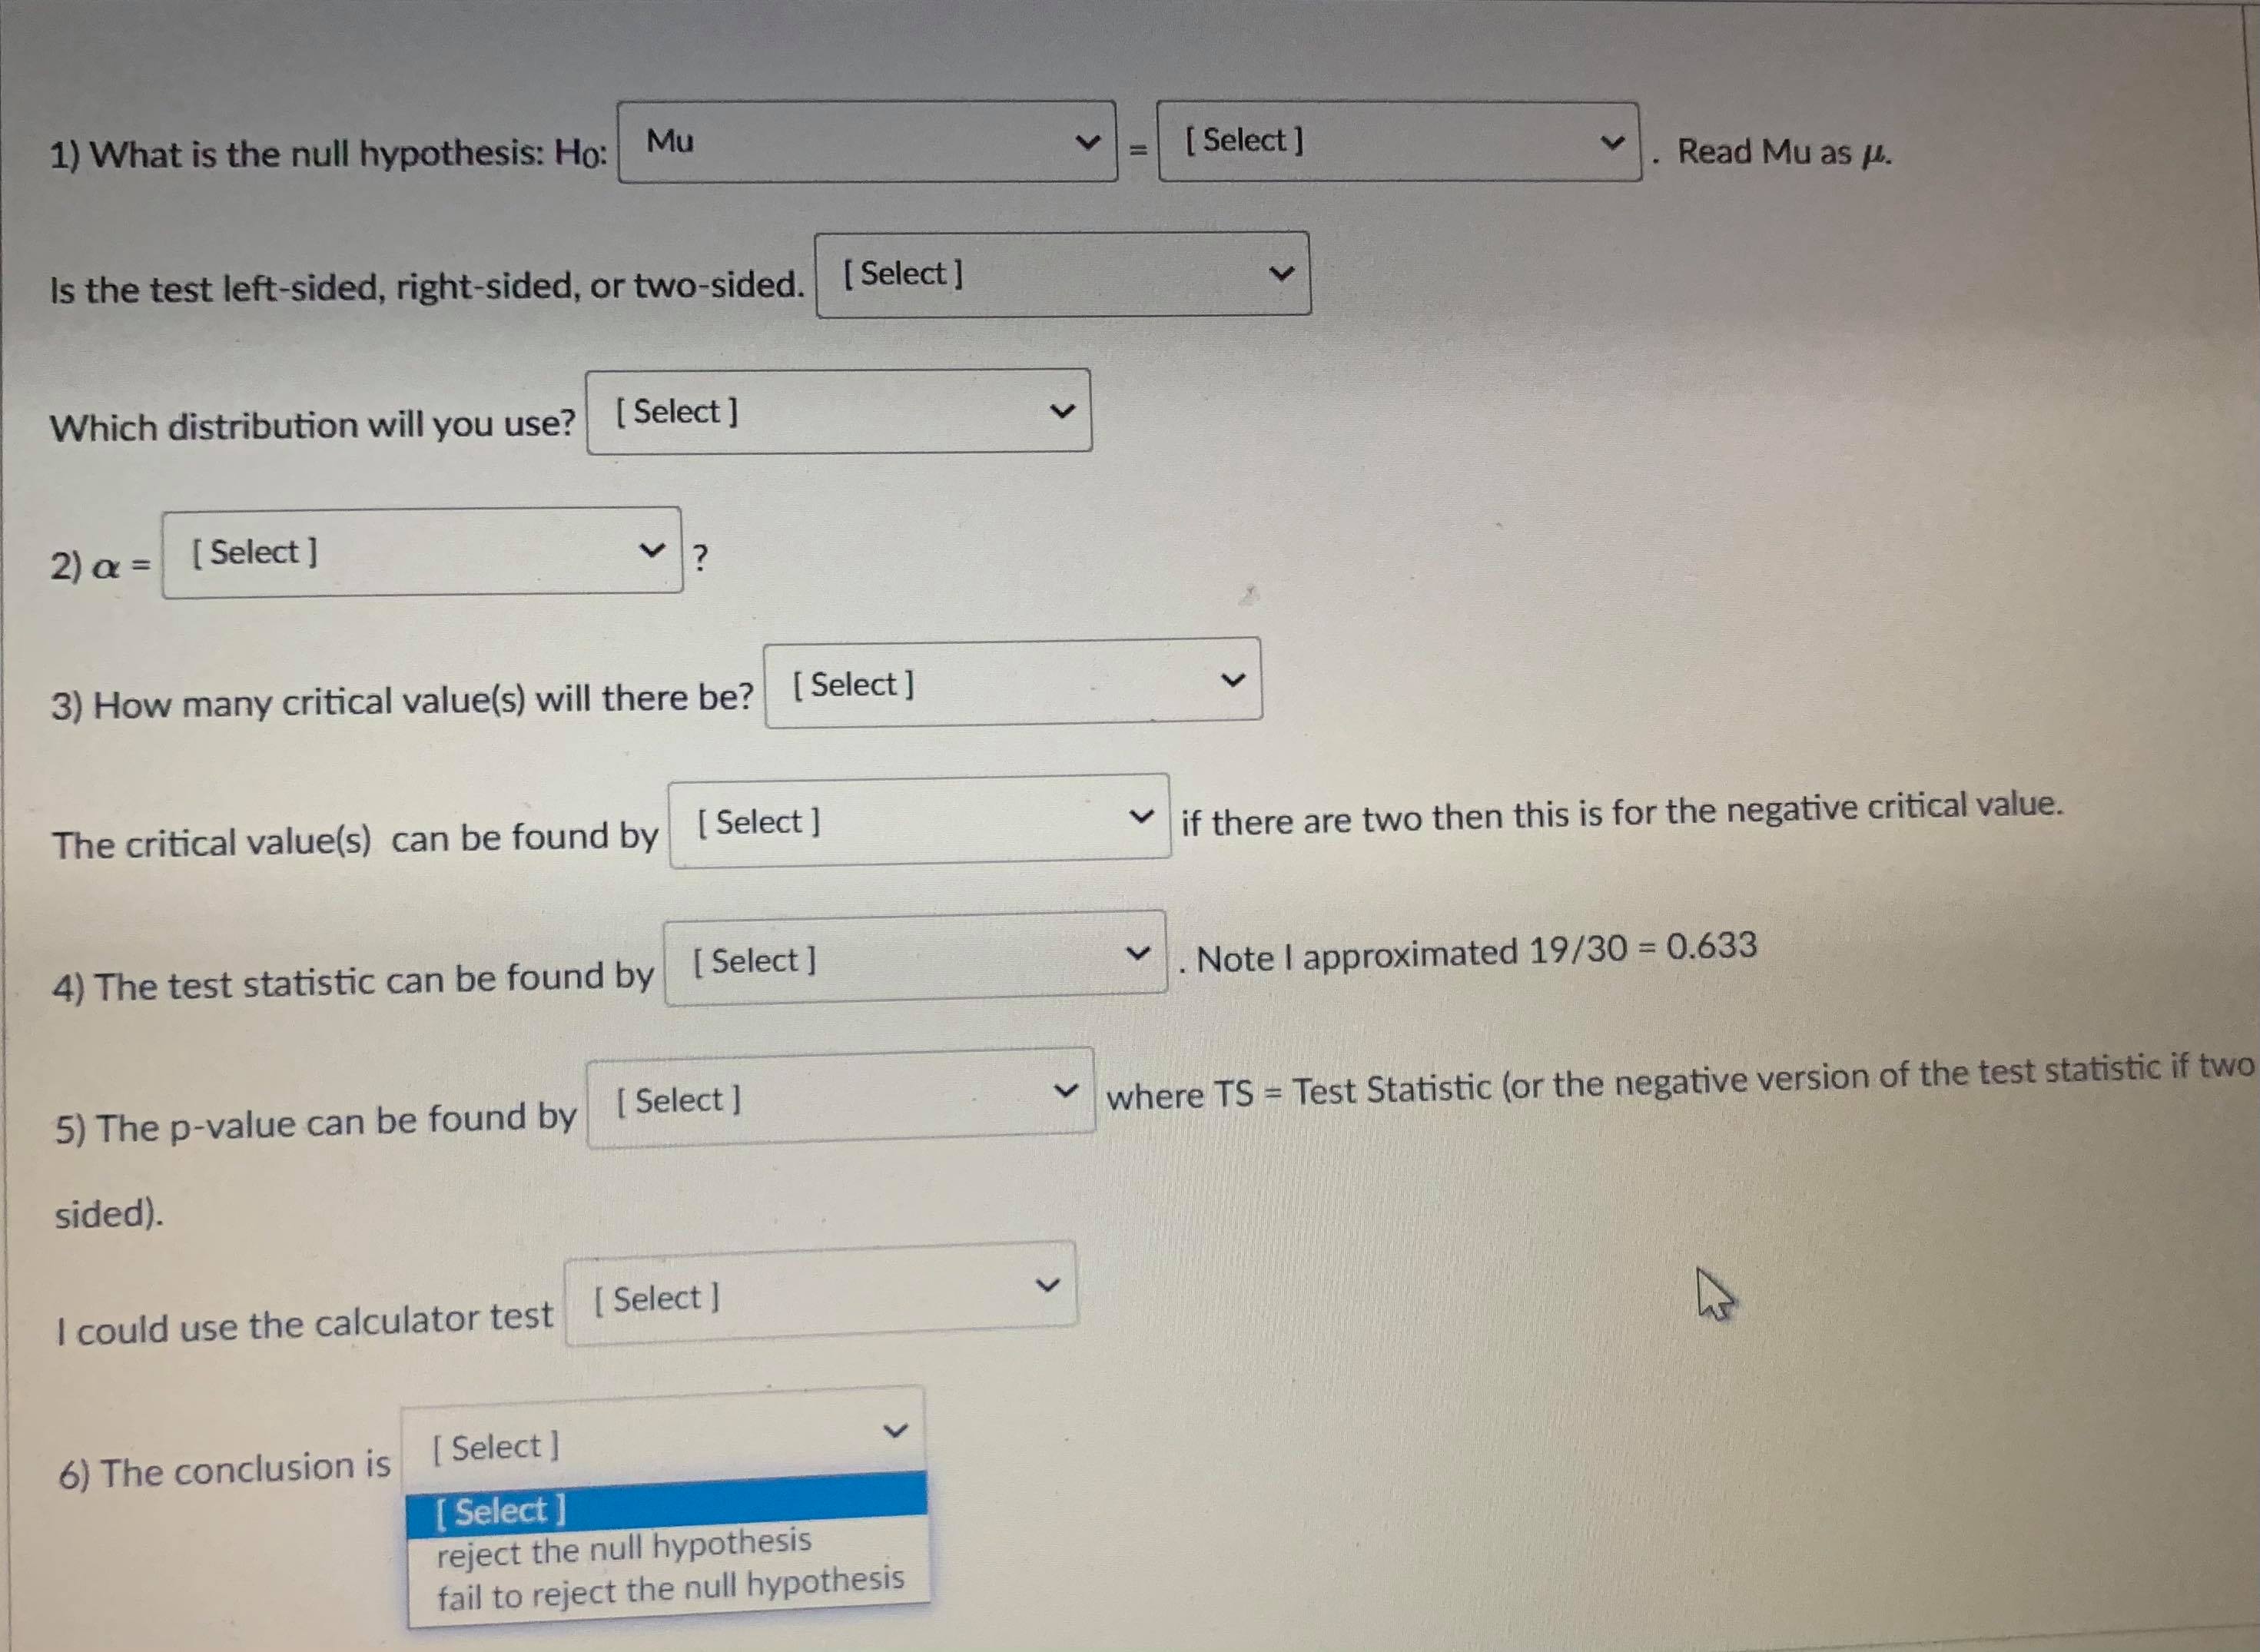
Question 13 1 pts A confidence interval is an interval approximation for the population parameter. In this course, we are learning to approximate the mean of a population and the proportion (percent) of a population in a particular category. Proportions always use the Z-distribution when approximationg the parameter. Means may use the Z-distribution only if the population standard deviation (o) is known. If we do not know the population standard deviation then we approximate with the sample standard deviation. IN that case, we use the t-distribution. The calculator commands are: 1-PropZint (For one sample proportions) Z-interval (For one sample means when o is known) T-interval (For one sample means when approximationg o with s). Careful: The problem will give you a standard deviation. You need to determine if it is representing the population () or the sample (s) by careful reading. Select if the problem is asking for a confidence interval to approximate the mean or proportion of the population, which distribution (Standard Normal(Z) or t-distribution)), and the calculator command you would use. A researcher wants to know how College students do on a college readiness test. From previous studies it is known that the standard deviation for all college students is 15%. They take an SRS of 100 students and administer the exam. The average score from 100 students who took the exam was 72%. They want to create a 90% confidence interval to approximate. This is a [ Select ] [ Select Z-Int The distribution is [ Select 1-PropZInt T-Int The calculator command is [ Select ]Question 13 1 pts A confidence interval is an interval approximation for the population parameter. In this course, we are learning to approximate the mean of a population and the proportion (percent) of a population in a particular category. Proportions always use the Z-distribution when approximationg the parameter. Means may use the Z-distribution only if the population standard deviation (o) is known. If we do not know the population standard deviation then we approximate with the sample standard deviation. IN that case, we use the t-distribution. The calculator commands are: 1-PropZInt (For one sample proportions) Z-interval (For one sample means when o is known) T-interval (For one sample means when approximationg o with s). Careful: The problem will give you a standard deviation. You need to determine if it is representing the population (o) or the sample (s) by careful reading. Select if the problem is asking for a confidence interval to approximate the mean or proportion of the population, which distribution (Standard Normal(Z) or t-distribution)), and the calculator command you would use. A researcher wants to know how College students do on a college readiness test. From previous studies it is known that the standard deviation for all college students is 15%. They take an SRS of 100 students and administer the exam. The average score from 100 students who took the exam was 72%. They want to create a 90% confidence interval to approximate. This is a [ Select ] The distribution is [Select ] [ Select Z (Normal) Distribution The calculator com t-distributionQuestion 13 1 pts A confidence interval is an interval approximation for the population parameter. In this course, we are learning to approximate the mean of a population and the proportion (percent) of a population in a particular category. Proportions always use the Z-distribution when approximationg the parameter. Means may use the Z-distribution only if the population standard deviation (o) is known. If we do not know the population standard deviation then we approximate with the sample standard deviation. IN that case, we use the t-distribution. The calculator commands are: 1-PropZInt (For one sample proportions) Z-interval (For one sample means when o is known) T-interval (For one sample means when approximationg o with s). Careful: The problem will give you a standard deviation. You need to determine if it is representing the population (o) or the sample (s) by careful reading. Select if the problem is asking for a confidence interval to approximate the mean or proportion of the population, which distribution (Standard Normal(Z) or t-distribution)), and the calculator command you would use. A researcher wants to know how College students do on a college readiness test. From previous studies it is known that the standard deviation for all college students is 15%. They take an SRS of 100 students and administer the exam. The average score from 100 students who took the exam was 72%. They want to create a 90% confidence interval to approximate. This is a [ Select ] [ Select] mean The distri proportion The calculator command is | Select ]Question 15 0.5 pts Each histogram in the following questions represents a random sample. We do not know if the variable has a normal distribution in the population, but we want to run a t-test to test a claim about the population mean. Choose the option that best describes how to proceed with the hypothesis test. This is a histogram of the data from a random sample of 17 individuals. Histogram & - sample size = 17 Requen Conditions may not be met. Conduct the T-test but include a disclaimer with the results. Conditions are not met. Do not use the T-test. Conditions are met. It is safe to proceed with the T-test.Problem: An administer claims that 60% of college freshmen pass a particular test. To test the claim an SRS of size 30 test scores was collected, 19 of which passed the exam. Test the claim to the 8% significance level. 1) What is the null hypothesis: Ho: Mu [ Select ] Read Mu as H. [ Select ] P Is the test left-sided, right-sided, or Mu Which distribution will you use? [ Select ] 2) a = [Select ] 3) How many critical value(s) will there be? [ Select ] The critical value(s) can be found by [ Select ] if there are two then this is for the negative critical value. 4) The test statistic can be found by [ Select ] . Note | approximated 19/30 = 0.633 5) The p-value can be found by [ Select ] . where TS = Test Statistic (or the negative version of the test statistic if two sided). I could use the calculator test [ Select ] 6) The conclusion is [ Select ]Problem: An administer claims that 60% of college freshmen pass a particular test. To test the claim an SRS of size 30 test scores was collected, 19 of which passed the exam. Test the claim to the 8% significance level. 1) What is the null hypothesis: Ho: Mu [ Select ] Read Mu as H. Select ] 08 Is the test left-sided, right-sided, or two-sided. [ Select ] 18 .633333 Which distribution will you use? [ Select ] 6 2 ) a = [ Select ] 3) How many critical value(s) will there be? [ Select ] The critical value(s) can be found by [ Select ] if there are two then this is for the negative critical value. 4) The test statistic can be found by [ Select ] . Note | approximated 19/30 = 0.633 5) The p-value can be found by [ Select ] where TS = Test Statistic (or the negative version of the test statistic if two sided). I could use the calculator test [ Select ] 6) The conclusion is [ Select ]Problem: An administer claims that 60% of college freshmen pass a particular test. To test the claim an SRS of size 30 test scores was collected, 19 of which passed the exam. Test the claim to the 8% significance level. 1) What is the null hypothesis: Ho: Mu [ Select ] Read Mu as H. Is the test left-sided, right-sided, or two-sided. [ Select ] Select right-sided Which distribution will you use? [ Select ] two-sided left-sided 2) a = [ Select ] 3) How many critical value(s) will there be? [ Select ] The critical value(s) can be found by [ Select ] if there are two then this is for the negative critical value. 4) The test statistic can be found by [ Select ] V . Note | approximated 19/30 = 0.633 5) The p-value can be found by [Select ] where TS = Test Statistic (or the negative version of the test statistic if two sided). I could use the calculator test [ Select ] 6) The conclusion is [ Select ]Problem: An administer claims that 60% of college freshmen pass a particular test. To test the claim an SRS of size 30 test scores was collected, 19 of which passed the exam. Test the claim to the 8% significance level. 1) What is the null hypothesis: Ho: Mu [ Select ] Read Mu as /. Is the test left-sided, right-sided, or two-sided. [ Select ] Which distribution will you use? [ Select ] [ Select t distribution 2) a = [ Select ] Z distribution 3) How many critical value(s) will there be? [ Select ] The critical value(s) can be found by [Select ] if there are two then this is for the negative critical value. 4) The test statistic can be found by [ Select ] . Note | approximated 19/30 = 0.633 5) The p-value can be found by [ Select ] where TS = Test Statistic (or the negative version of the test statistic if two sided). I could use the calculator test [ Select ] 6) The conclusion is [ Select ]1) What is the null hypothesis: Ho: Mu [ Select ] Read Mu as /. Is the test left-sided, right-sided, or two-sided. [ Select ] Which distribution will you use? [ Select ] 2) a = [ Select ] Select ] 63333333 3) How .60 be? [ Select ] 30 08 The critical value(s) can be found by [ Select ] if there are two then this is for the negative critical value. 4) The test statistic can be found by [ Select ] . Note | approximated 19/30 = 0.633 5) The p-value can be found by [ Select ] where TS - Test Statistic (or the negative version of the test statistic if two sided). I could use the calculator test [ Select ] 6) The conclusion is [ Select |1) What is the null hypothesis: Ho: Mu [ Select ] Read Mu as /. Is the test left-sided, right-sided, or two-sided. [Select ] Which distribution will you use? [ Select ] 2) a = [ Select ] 3) How many critical value(s) will there be? [ Select ] [ Select 1 The critical value(s) can be found by [ Sele 2 e are two then this is for the negative critical value. 4) The test statistic can be found by [ Select ] . Note I approximated 19/30 = 0.633 5) The p-value can be found by [ Select ] where TS = Test Statistic (or the negative version of the test statistic if two sided). I could use the calculator test [ Select ] 6) The conclusion is [ Select ]1) What is the null hypothesis: Ho: Mu [ Select ] Read Mu as /. Is the test left-sided, right-sided, or two-sided. [ Select ] Which distribution will you use? [ Select ] 2) a = [ Select ] 3) How many critical value(s) will there be? [ Select ] The critical value(s) can be found by [ Select ] if there are two then this is for the negative critical value. Select tcdf(-10000000000,.08,29) 4) The test statistic can be found by invT(.08,29) Note I approximated 19/30 = 0.633 normalcdf(.08,1000000000) tcdf(.08,10000000000,29) 5) The p-value can be found by [ Sel normalcdf(-100000000,.08) invT(.04,29) e TS = Test Statistic (or the negative version of the test statistic if two sided). invnorm(.04) invnorm(.08) I could use the calculator test [ Select ] 6) The conclusion is [ Select ]1) What is the null hypothesis: Ho: Mu [ Select ] Read Mu as /. Is the test left-sided, right-sided, or two-sided. [ Select ] Which distribution will you use? [ Select ] 2) a = [Select ] 3) How many critical value(s) will there be? [ Select ] The critical value(s) can be found by [ Select ] if there are two then this is for the negative critical value. 4) The test statistic can be found by [ Select ] . Note | approximated 19/30 = 0.633 Select ] (.6-.633)/(sqrt(.633*.367/30)) 5) The p-value can be found by [Se (.633-.6)/(sqrt(.633*.367/30)) re TS - Test Statistic (or the negative version of the test statistic if two (.6-.633)/(sqrt(.6*.4/30)) sided). (.633-.6)/(sqrt(.6*.4/30)) I could use the calculator test [ Select ] 6) The conclusion is [ Select ]1) What is the null hypothesis: Ho: Mu [ Select ] Read Mu as u. Is the test left-sided, right-sided, or two-sided. [ Select ] Which distribution will you use? [ Select ] 2) Or = [ Select ] 3) How many critical value(s) will there be? [ Select ] The critical value(s) can be found by [ Select ] v if there are two then this is for the negative critical value. 4) The test statistic can be found by [ Select ] . Note I approximated 19/30 = 0.633 hr 5) The p-value can be found by [ Select ] where TS = Test Statistic (or the negative version of the test statistic if two Select sided). tcdf(-100000000000, TS, 39) 2*normalcdf(-10000000000, TS, 0, 1) could use the calculator test normalcdf(-10000000000, TS, 0, 1) normalcdf(TS,10000000000, 0, 1) 2"tedf(-100000000000, TS, 39) tcdf(TS, 100000000000, 39) 6) The conclusion is [ Select ]1) What is the null hypothesis: Ho: Mu [ Select ] Read Mu as /. Is the test left-sided, right-sided, or two-sided. [ Select ] Which distribution will you use? [ Select ] 2) a = [ Select ] 3) How many critical value(s) will there be? [ Select ] The critical value(s) can be found by [ Select ] V if there are two then this is for the negative critical value. 4) The test statistic can be found by [ Select ] Note I approximated 19/30 = 0.633 5) The p-value can be found by [ Select ] where TS = Test Statistic (or the negative version of the test statistic if two sided). I could use the calculator test [ Select ] [ Select ] 1-PropZTest 6) The conclusion is [Select ] T-Test Z-Test1) What is the null hypothesis: Ho: Mu [ Select ] Read Mu as /. Is the test left-sided, right-sided, or two-sided. [ Select ] Which distribution will you use? [ Select ] 2) a = [ Select ] 3) How many critical value(s) will there be? [ Select ] The critical value(s) can be found by [ Select ] if there are two then this is for the negative critical value. 4) The test statistic can be found by [ Select ] . Note I approximated 19/30 = 0.633 5) The p-value can be found by [ Select ] where TS - Test Statistic (or the negative version of the test statistic if two sided). I could use the calculator test [ Select ] 6) The conclusion is [ Select ] [ Select reject the null hypothesis fail to reject the null hypothesis
Step by Step Solution
There are 3 Steps involved in it

Get step-by-step solutions from verified subject matter experts