

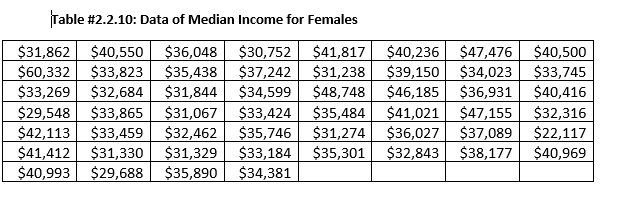
Question: 2.2.6 Create a histogram and relative frequency histogram for the data in table #2.2.10.Describe the shape and any findings you can from the graph. 2.2.10
2.2.6
Create a histogram and relative frequency histogram for the data in table #2.2.10.Describe the shape and any findings you can from the graph.
2.2.10
Create an ogive for the data in table #2.2.10.Describe any findings you can from the graph.
\f
Step by Step Solution
There are 3 Steps involved in it
1 Expert Approved Answer
Step: 1 Unlock

Question Has Been Solved by an Expert!
Get step-by-step solutions from verified subject matter experts
Step: 2 Unlock
Step: 3 Unlock