

Question: it also says to create a histogram and relative frequency histogram for the data in table #2.2.12. Describe the shape and any findings you can
it also says to create a histogram and relative frequency histogram for the data in table #2.2.12. Describe the shape and any findings you can from the graph
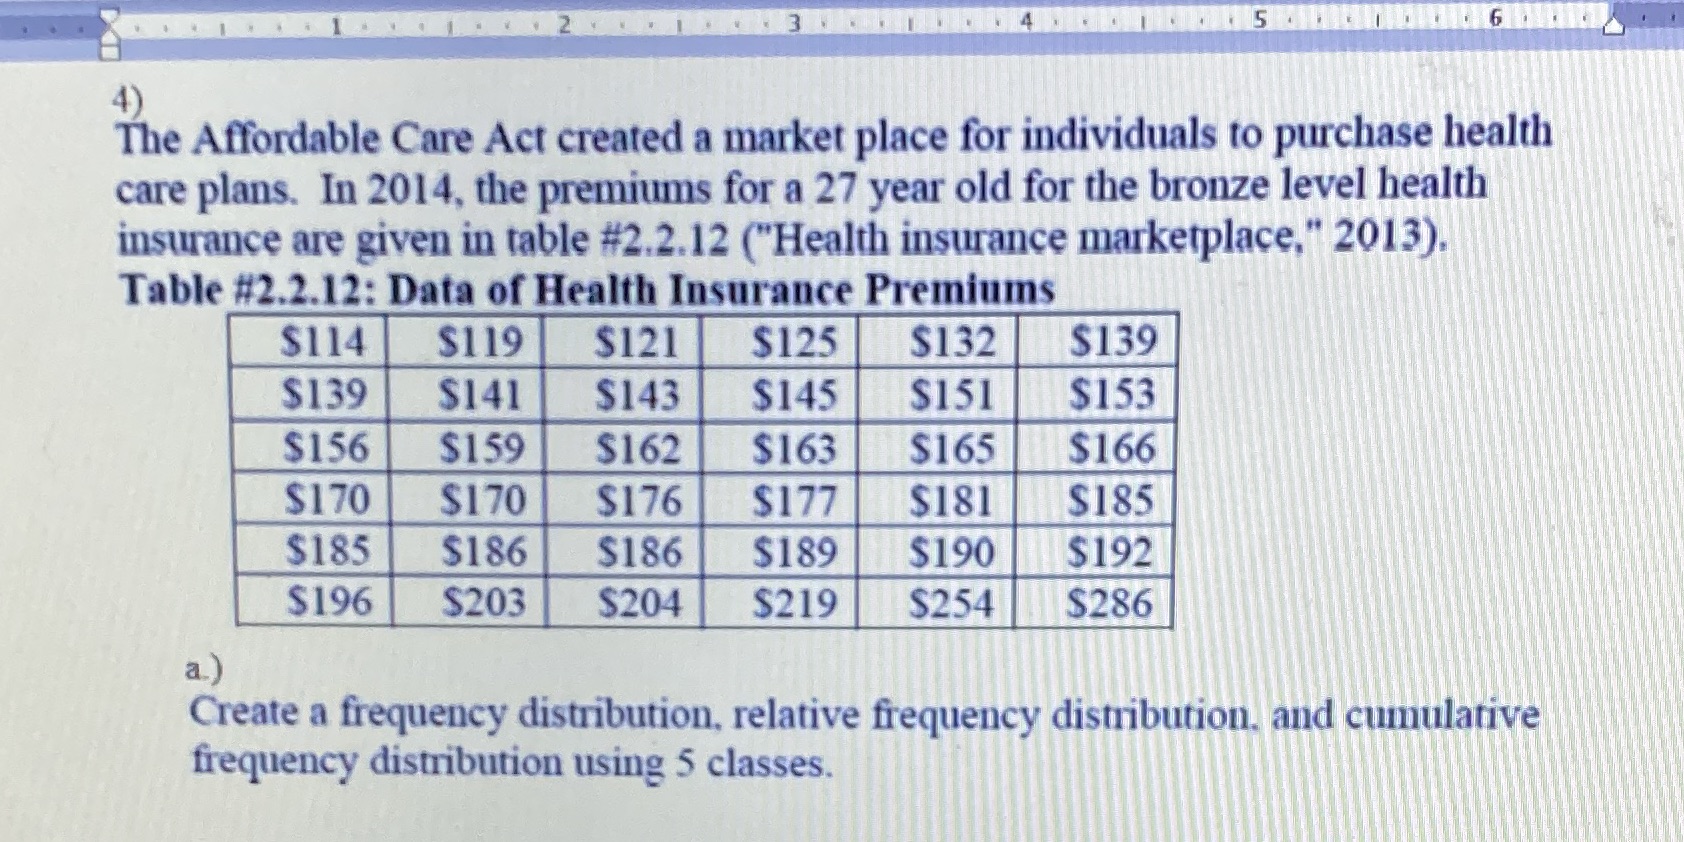
4) The Affordable Care Act created a market place for individuals to purchase health care plans. In 2014, the premiums for a 27 year old for the bronze level health insurance are given in table #2.2.12 ("Health insurance marketplace," 2013). Table #2.2.12: Data of Health Insurance Premiums $114 $119 $121 $125 $132 $139 $139 $141 $143 $145 $151 $153 $156 $159 $162 $163 $165 $166 $170 $170 $176 $177 $181 $185 $185 $186 $186 $189 $190 $192 $196 $203 $204 $219 $254 $286 a.) Create a frequency distribution, relative frequency distribution. and cumulative frequency distribution using 5 classes
Step by Step Solution
There are 3 Steps involved in it

Get step-by-step solutions from verified subject matter experts