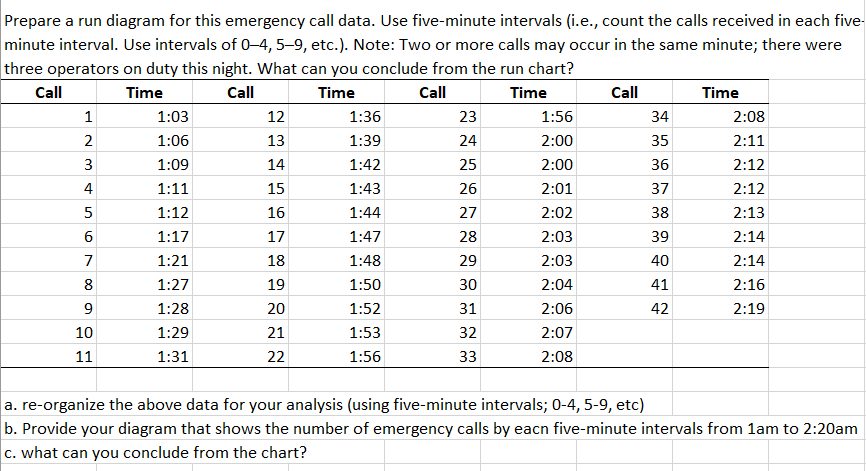
Question: 23 Prepare a run diagram for this emergency call data. Use five-minute intervals (i.e., count the calls received in each five- minute interval. Use intervals

23 Prepare a run diagram for this emergency call

23 Prepare a run diagram for this emergency call data. Use five-minute intervals (i.e., count the calls received in each five- minute interval. Use intervals of 0-4,5-9, etc.). Note: Two or more calls may occur in the same minute; there were three operators on duty this night. What can you conclude from the run chart? Call Time Call Time Call Time Call Time 1 1:03 12 1:36 1:56 34 2:08 2 1:06 13 1:39 24 2:00 35 2:11 3 1:09 14 1:42 25 2:00 36 2:12 4 1:11 15 1:43 26 2:01 37 2:12 5 1:12 16 1:44 27 2:02 38 2:13 6 1:17 17 1:47 28 2:03 39 2:14 7 1:21 18 1:48 29 2:03 40 2:14 8 1:27 19 1:50 30 2:04 41 2:16 9 1:28 20 1:52 31 2:06 42 2:19 10 1:29 21 1:53 32 2:07 11 1:31 22 1:56 33 2:08 a. re-organize the above data for your analysis (using five-minute intervals; 0-4, 5-9, etc) b. Provide your diagram that shows the number of emergency calls by eacn five-minute intervals from 1am to 2:20am c. what can you conclude from the chart

Step by Step Solution

There are 3 Steps involved in it

1 Expert Approved Answer
Step: 1 Unlock blur-text-image
Question Has Been Solved by an Expert!

Get step-by-step solutions from verified subject matter experts

Step: 2 Unlock
Step: 3 Unlock

Students Have Also Explored These Related General Management Questions!