

Question: 2.3 To plot y (x, t) = A sin (kx wt) as a function of one of the variables x and t, the other variable
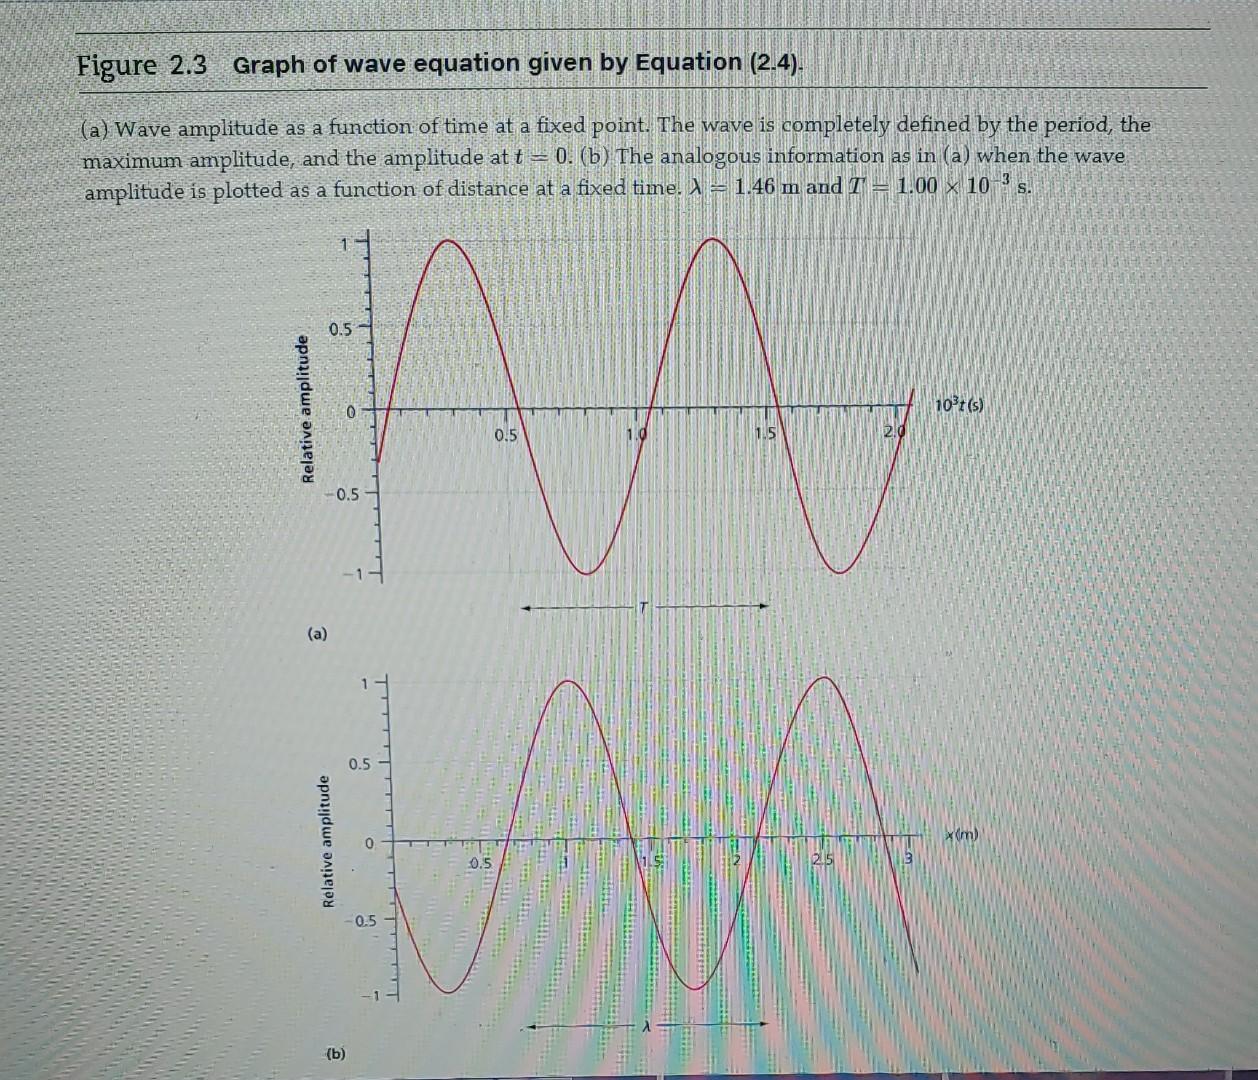
2.3 To plot y (x, t) = A sin (kx wt) as a function of one of the variables x and t, the other variable needs to be set at a fixed value, x, or to. If y (20, 0) { max = -0.280, what is the constant value of x, in the upper panel of Figure 2.30? If I (0, to) /max = -0.309, what is the constant value of t, in the lower panel of Figure 2.30? (Hint: The inverse sine function has two solutions within an interval of 27. Make sure that you choose the correct one.) Figure 2.3 Graph of wave equation given by Equation (2.4). (a) Wave amplitude as a function of time at a fixed point. The wave is completely defined by the period, the maximum amplitude, and the amplitude at t = 0.(b) The analogous information as in (a) when the wave amplitude is plotted as a function of distance at a fixed time. X = 1.46 m and I = 1.00 x 10⁻³ S. 0.5 Relative amplitude 0 10t(s) 0.5 1.0 0.5 (a) 0.5 xim) H 2.5 (b)
Step by Step Solution
There are 3 Steps involved in it

Get step-by-step solutions from verified subject matter experts