

Question: 23 Which graph represents the function f(x) = -4 x - 9 - 52 ed out of Select one: O a. -20-- .16- -16 -17

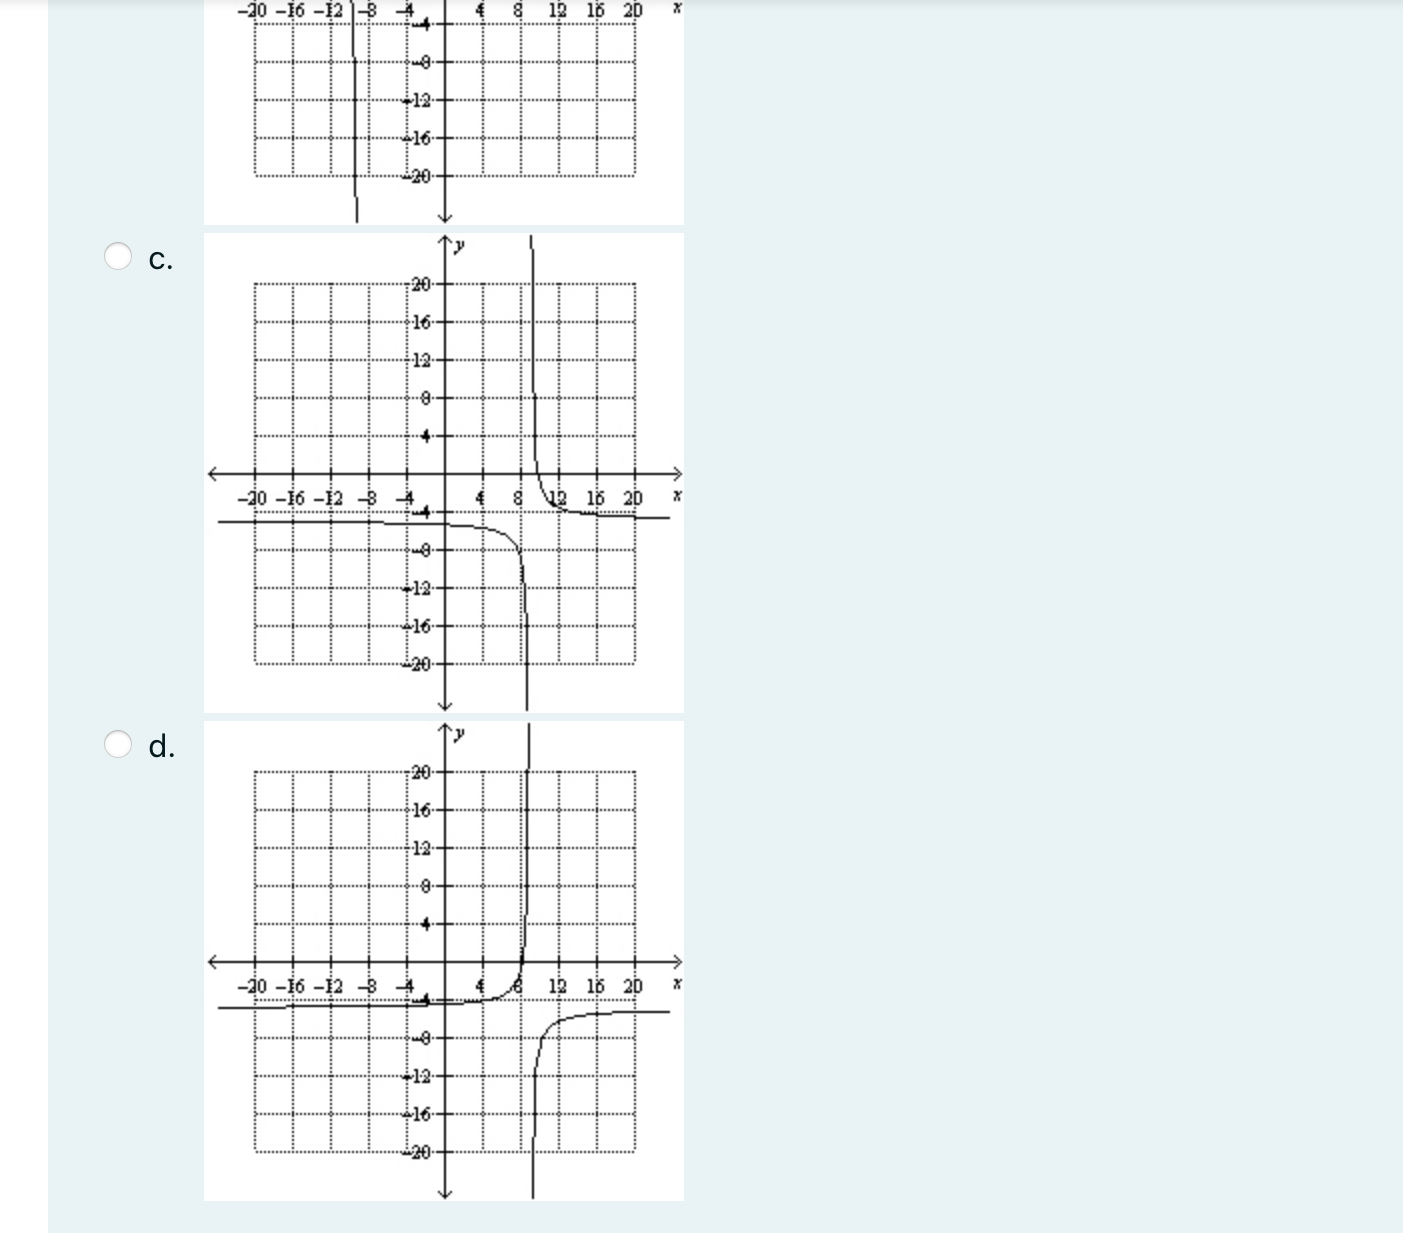
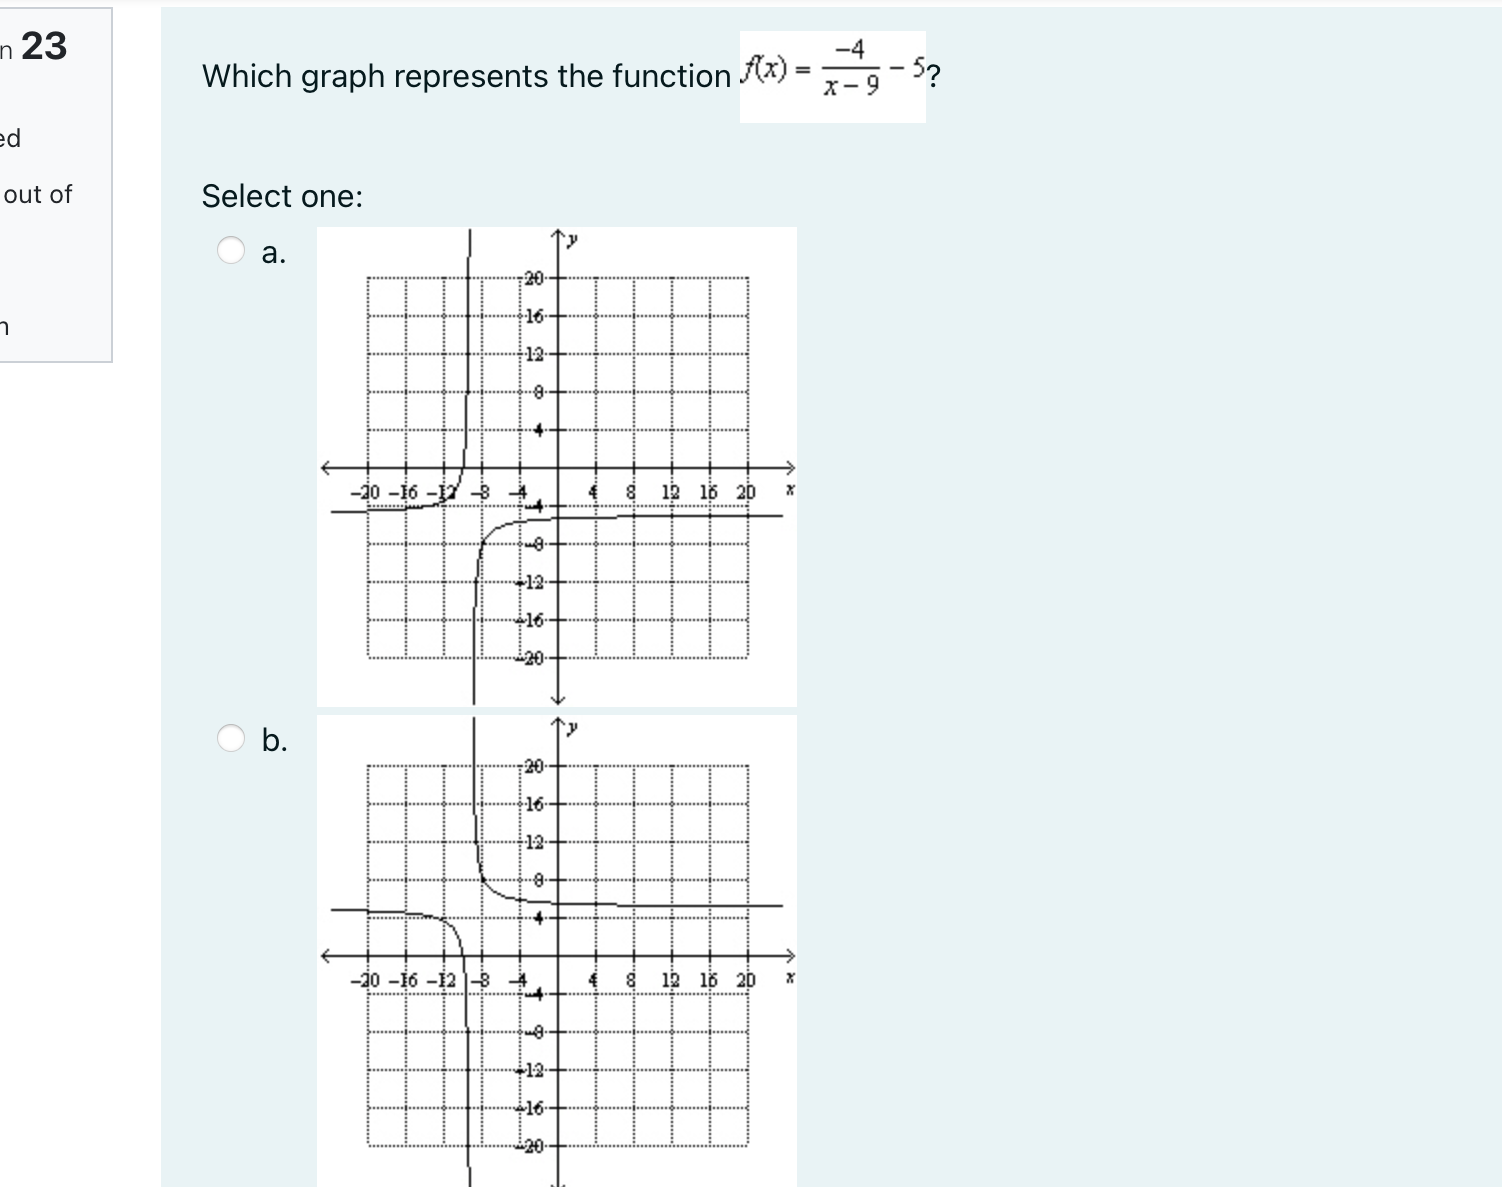

23 Which graph represents the function f(x) = -4 x - 9 - 52 ed out of Select one: O a. -20-- .16- -16 -17 5 12 16 20 20-- O b. 12 16 20 * 120--12 .16- O c. Ty .20- ....8. -30 -16 -12 72 16 20 ..416- .20- O d. -16-- -20 -16 -12 12 16 20 $16
Step by Step Solution
There are 3 Steps involved in it
1 Expert Approved Answer
Step: 1 Unlock

Question Has Been Solved by an Expert!
Get step-by-step solutions from verified subject matter experts
Step: 2 Unlock
Step: 3 Unlock