

Question: 2.3. With reference to Diagram 2.1, explain the relationship between price elasticity of demand and total revenue, highlighting how changes in elasticity influence revenue along
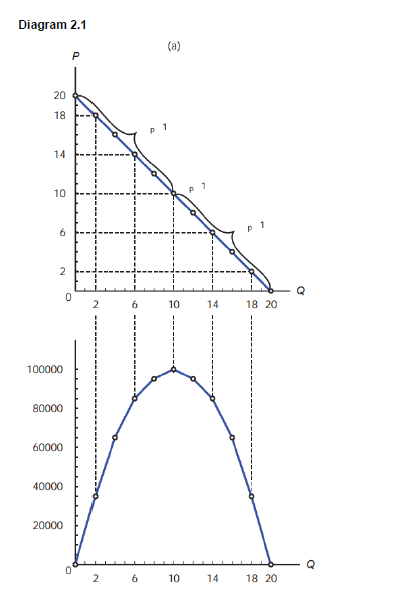
2.3. With reference to Diagram 2.1, explain the relationship between price elasticity of demand and total revenue, highlighting how changes in elasticity influence revenue along the demand curve. (8)
Step by Step Solution
There are 3 Steps involved in it
1 Expert Approved Answer
Step: 1 Unlock

Question Has Been Solved by an Expert!
Get step-by-step solutions from verified subject matter experts
Step: 2 Unlock
Step: 3 Unlock