

Question: 2-35 Basic Cost-Volume Graphs From the following two graphs, construct two graphs that depict the cost behavior on a per-square- foot basis for volumes ranging
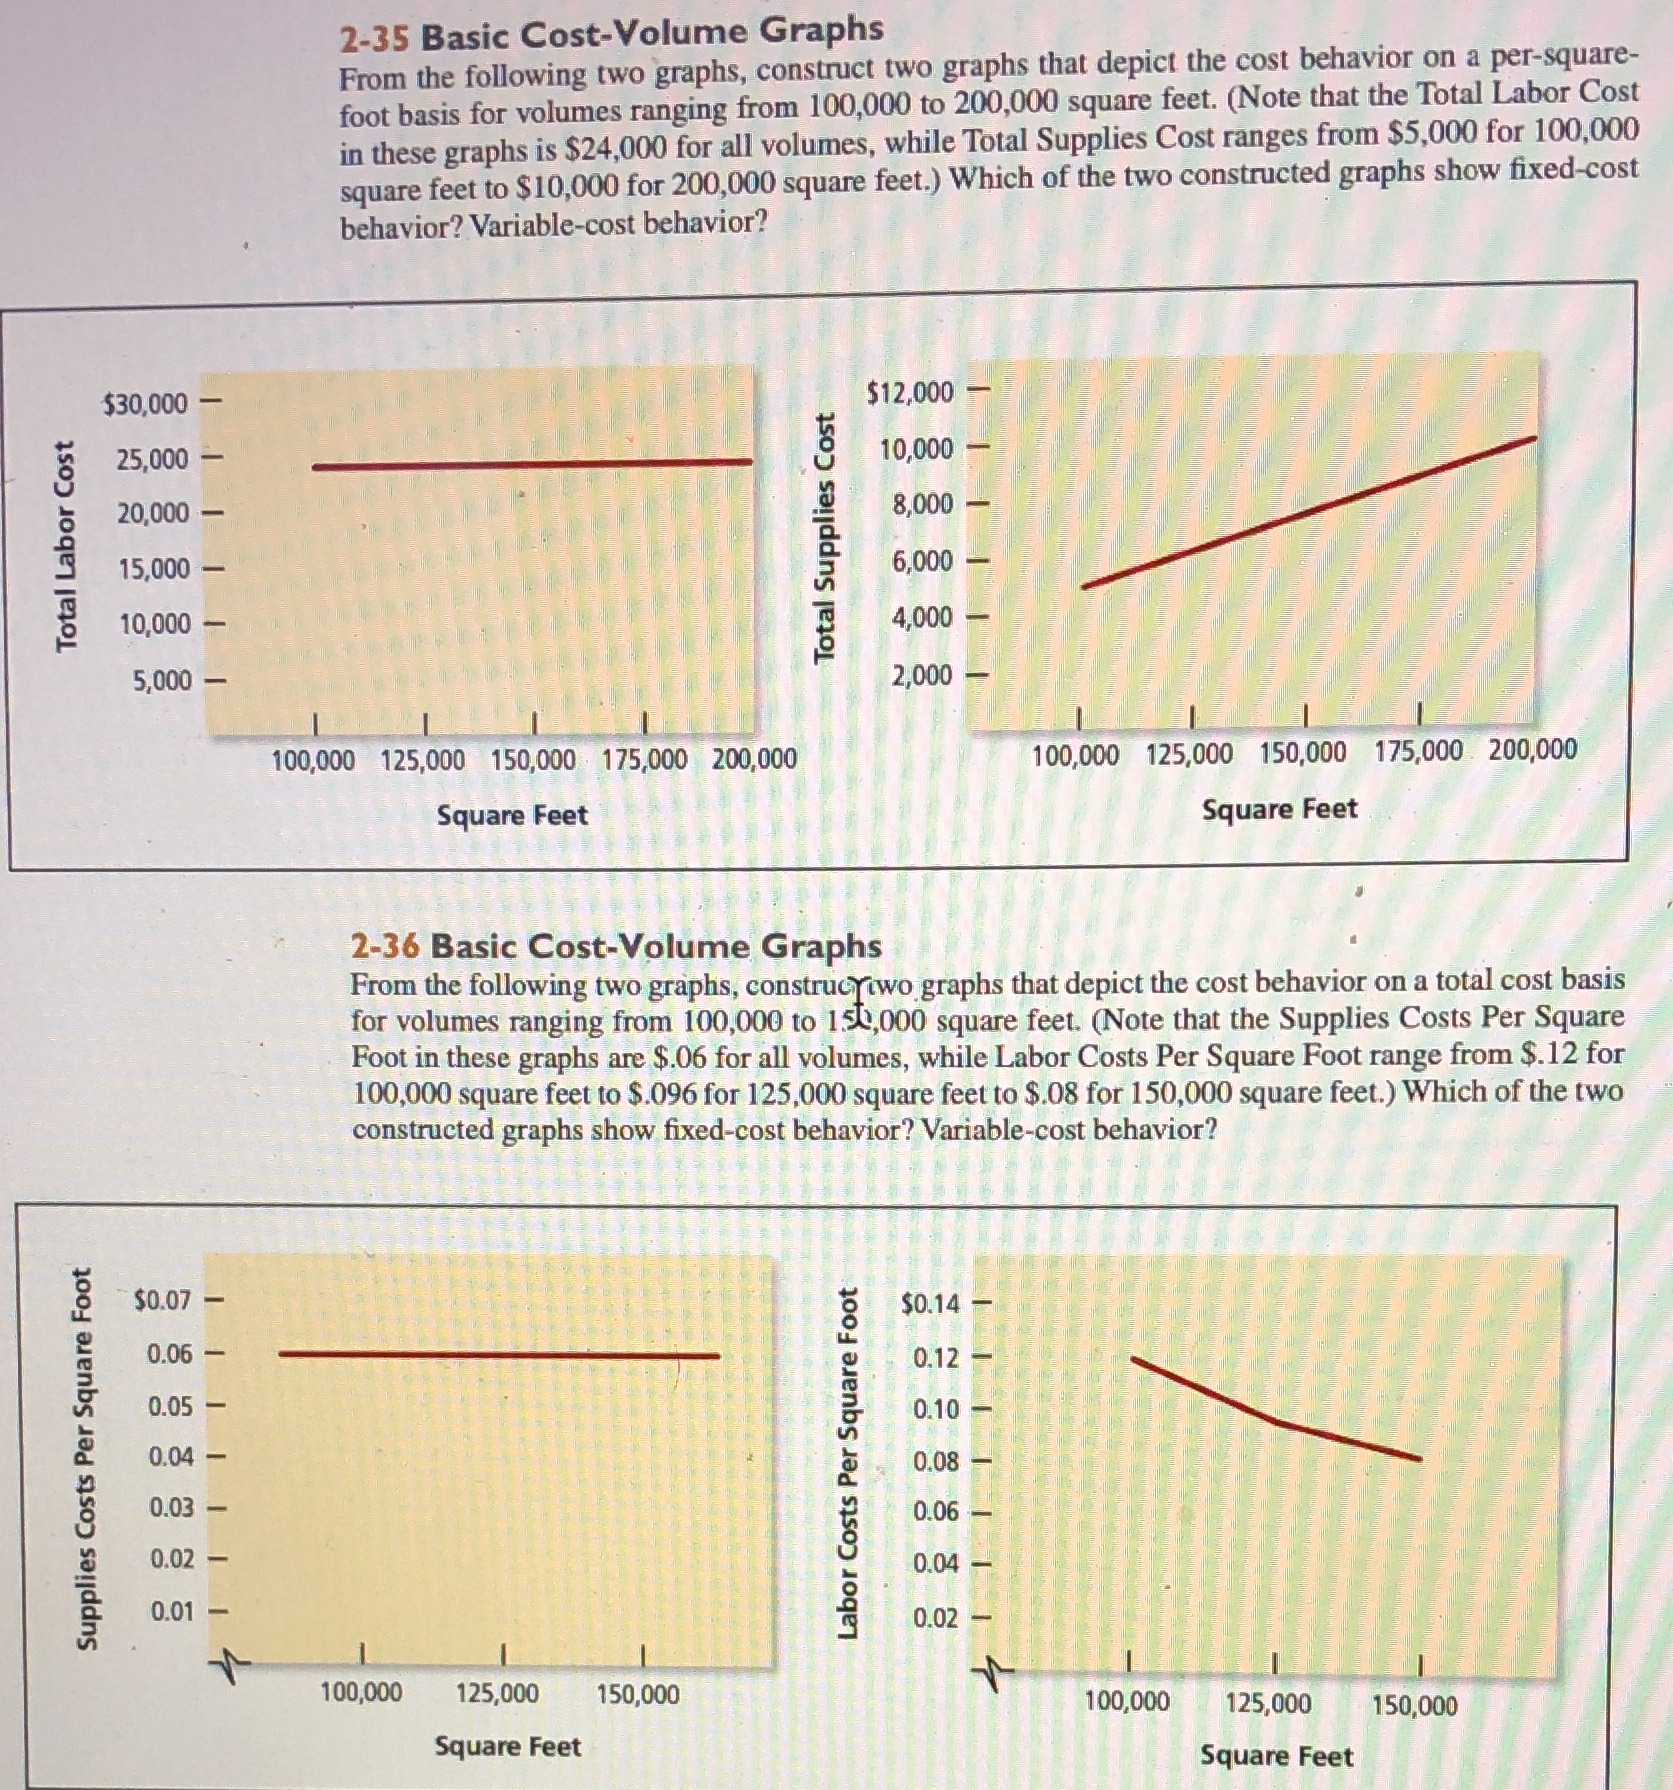
2-35 Basic Cost-Volume Graphs From the following two graphs, construct two graphs that depict the cost behavior on a per-square- foot basis for volumes ranging from 100,000 to 200,000 square feet. (Note that the Total Labor Cost in these graphs is $24,000 for all volumes, while Total Supplies Cost ranges from $5,000 for 100,000 square feet to $10,000 for 200,000 square feet.) Which of the two constructed graphs show fixed-cost behavior? Variable-cost behavior? $30,000 - $12,000 25,000 - 10,000 20,000 - 8,000 Total Supplies Cost Total Labor Cost 15,000 - 6,000 10,000 - 4,000 5,000 - 2,000 100,000 125,000 150,000 . 175,000 200,000 100,000 125,000 150,000 175,000 200,000 Square Feet Square Feet 2-36 Basic Cost-Volume Graphs From the following two graphs, construcytwo graphs that depict the cost behavior on a total cost basis for volumes ranging from 100,000 to 150,000 square feet. (Note that the Supplies Costs Per Square Foot in these graphs are $.06 for all volumes, while Labor Costs Per Square Foot range from $.12 for 100,000 square feet to $.096 for 125,000 square feet to $.08 for 150,000 square feet.) Which of the two constructed graphs show fixed-cost behavior? Variable-cost behavior? $0.07 - $0.14 - 0.06 - 0.12 - 0.05 0.10 - Supplies Costs Per Square Foot 0.04 - Labor Costs Per Square Foot 0.08 0.03 - 0.06 0.02 0.04 0.01 - 0.02 100,000 125,000 150,000 100,000 125,000 150,000 Square Feet Square Feet
Step by Step Solution
There are 3 Steps involved in it

Get step-by-step solutions from verified subject matter experts