

Question: 24 and 25 are needed. please use as much calculator work as possible Use the following information for questions 21 through 25. A survey was

24 and 25 are needed. please use as much calculator work as possible
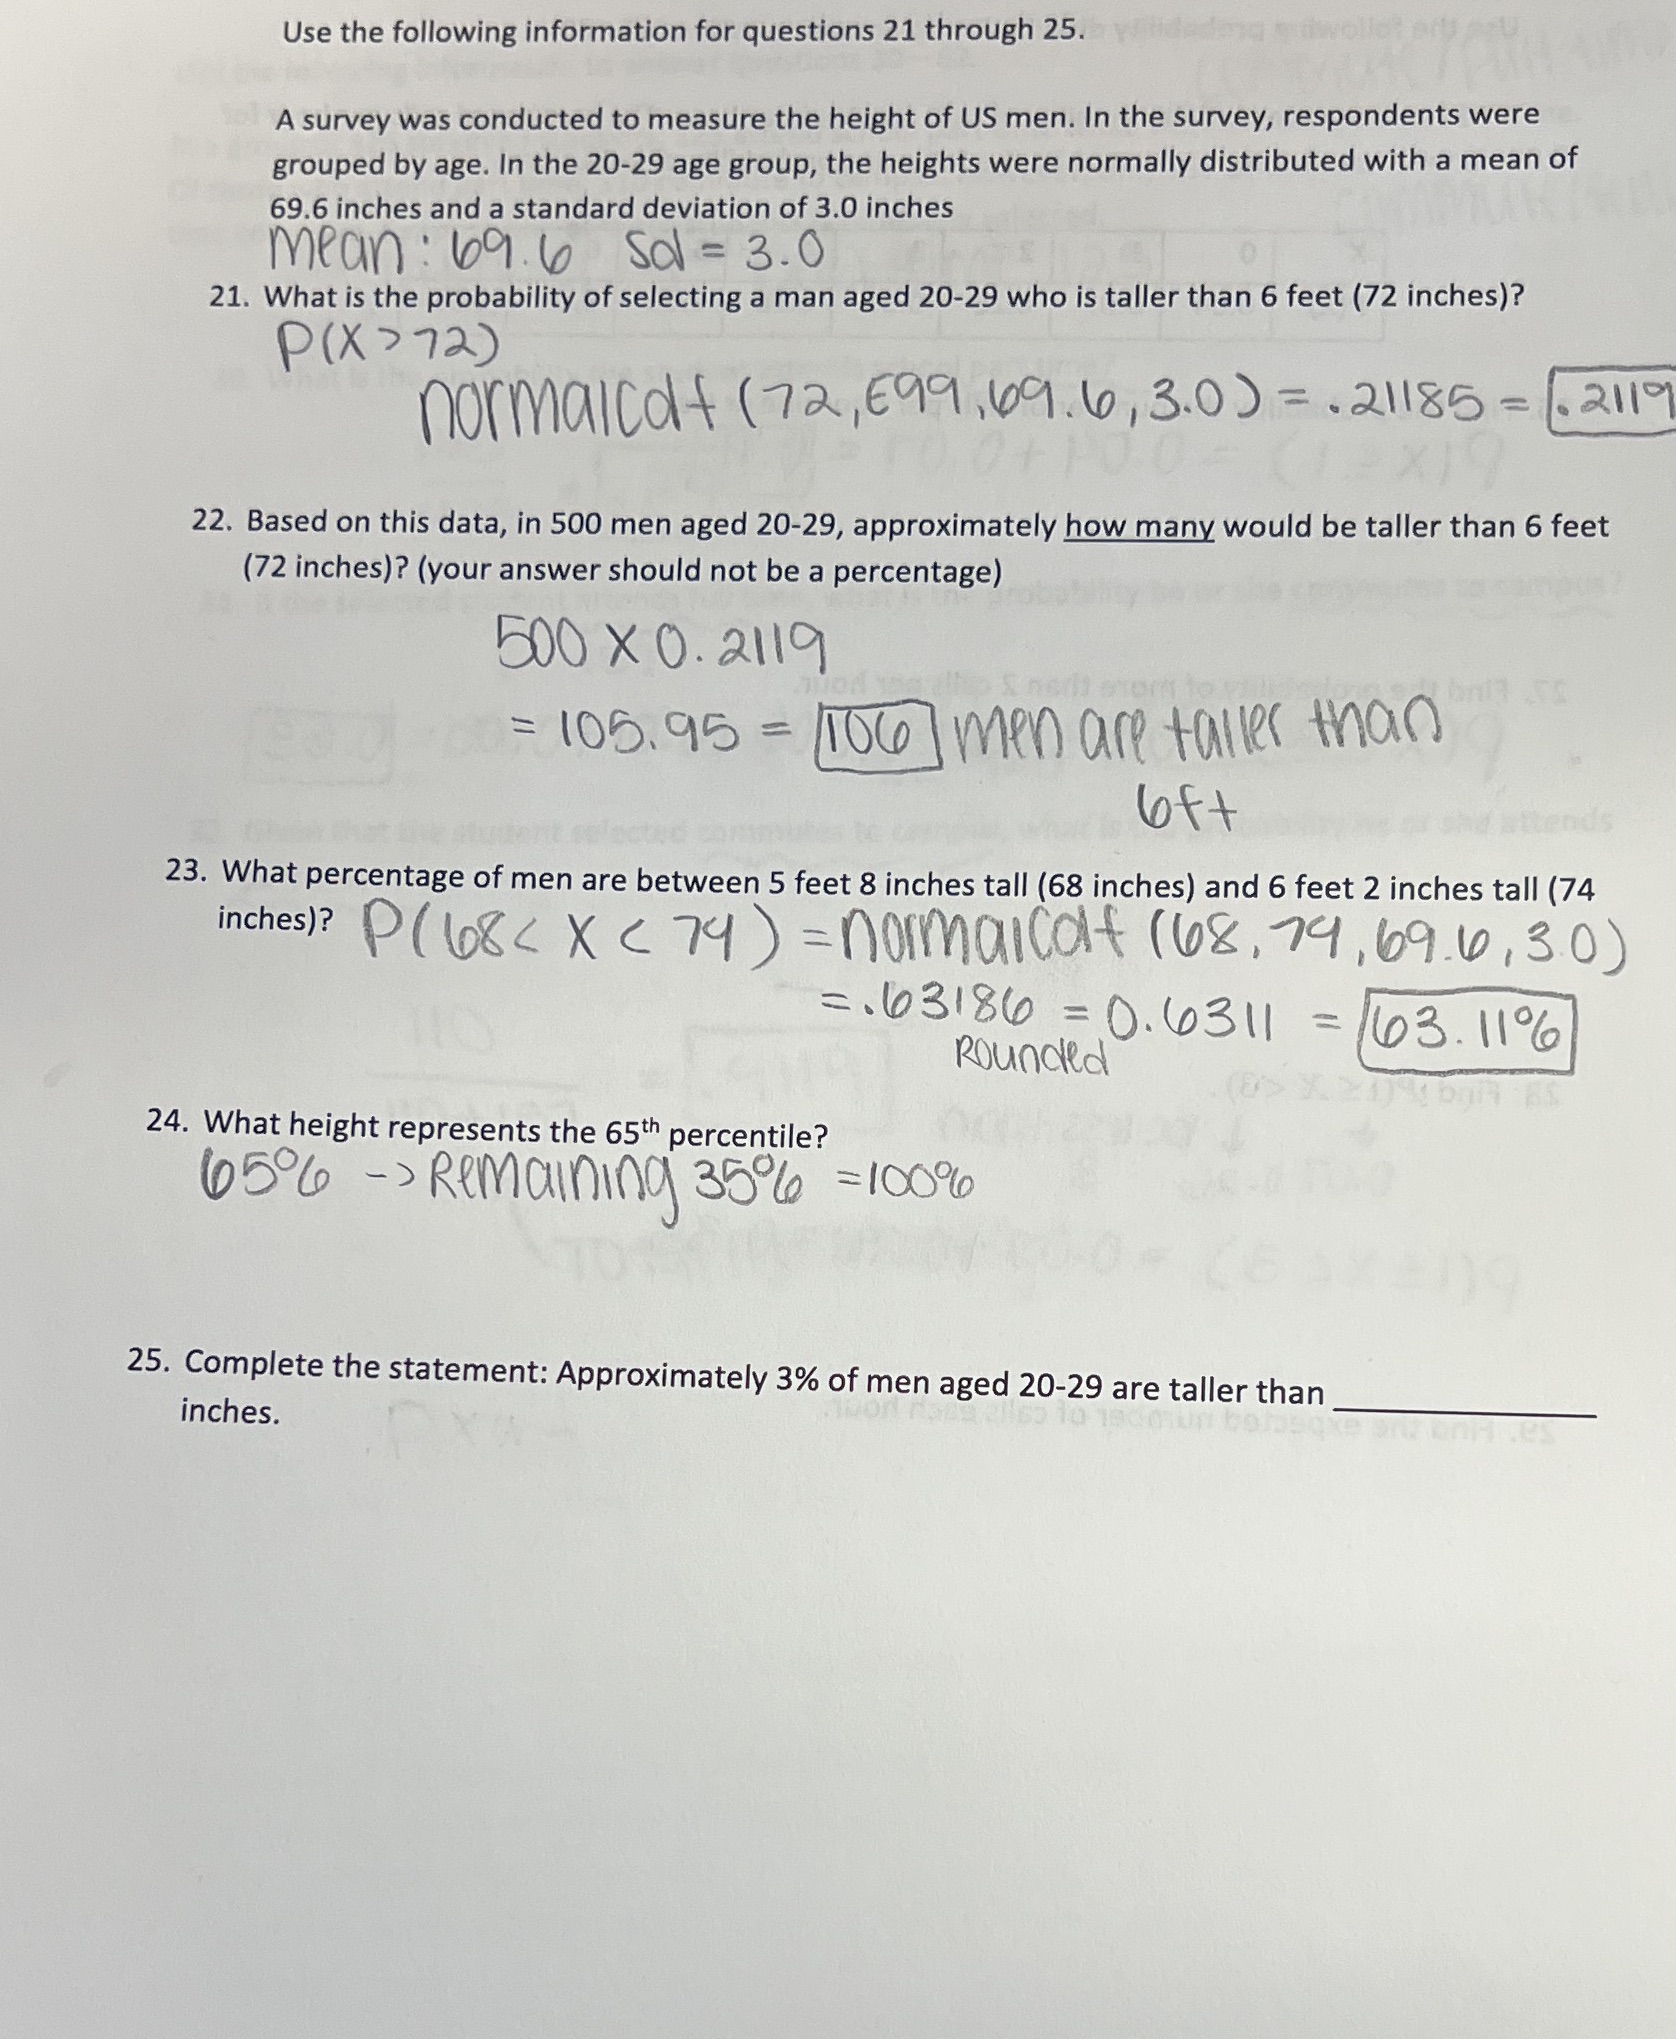
Use the following information for questions 21 through 25. A survey was conducted to measure the height of US men. In the survey, respondents were grouped by age. In the 20-29 age group, the heights were normally distributed with a mean of 69.6 inches and a standard deviation of 3.0 inches mean: 69.6 501 = 3.0 21. What is the probability of selecting a man aged 20-29 who is taller than 6 feet (72 inches)? P (X >72) normalcdf ( 72, E99 , 69 . 6 , 3.0 ) = . 21185 = . 2110 22. Based on this data, in 500 men aged 20-29, approximately how many would be taller than 6 feet (72 inches)? (your answer should not be a percentage) 500 X 0. 2119 = 105. 95 = /106 ] men are taller than loft 23. What percentage of men are between 5 feet 8 inches tall (68 inches) and 6 feet 2 inches tall (74 inches)? P ( 108
Step by Step Solution
There are 3 Steps involved in it

Get step-by-step solutions from verified subject matter experts