

Question: 24. Determine a. the slope, b. y-intercept, and c. equation of each line shown: a. e.25.Using the PhET Simulation in your lessons called Graphing Lines
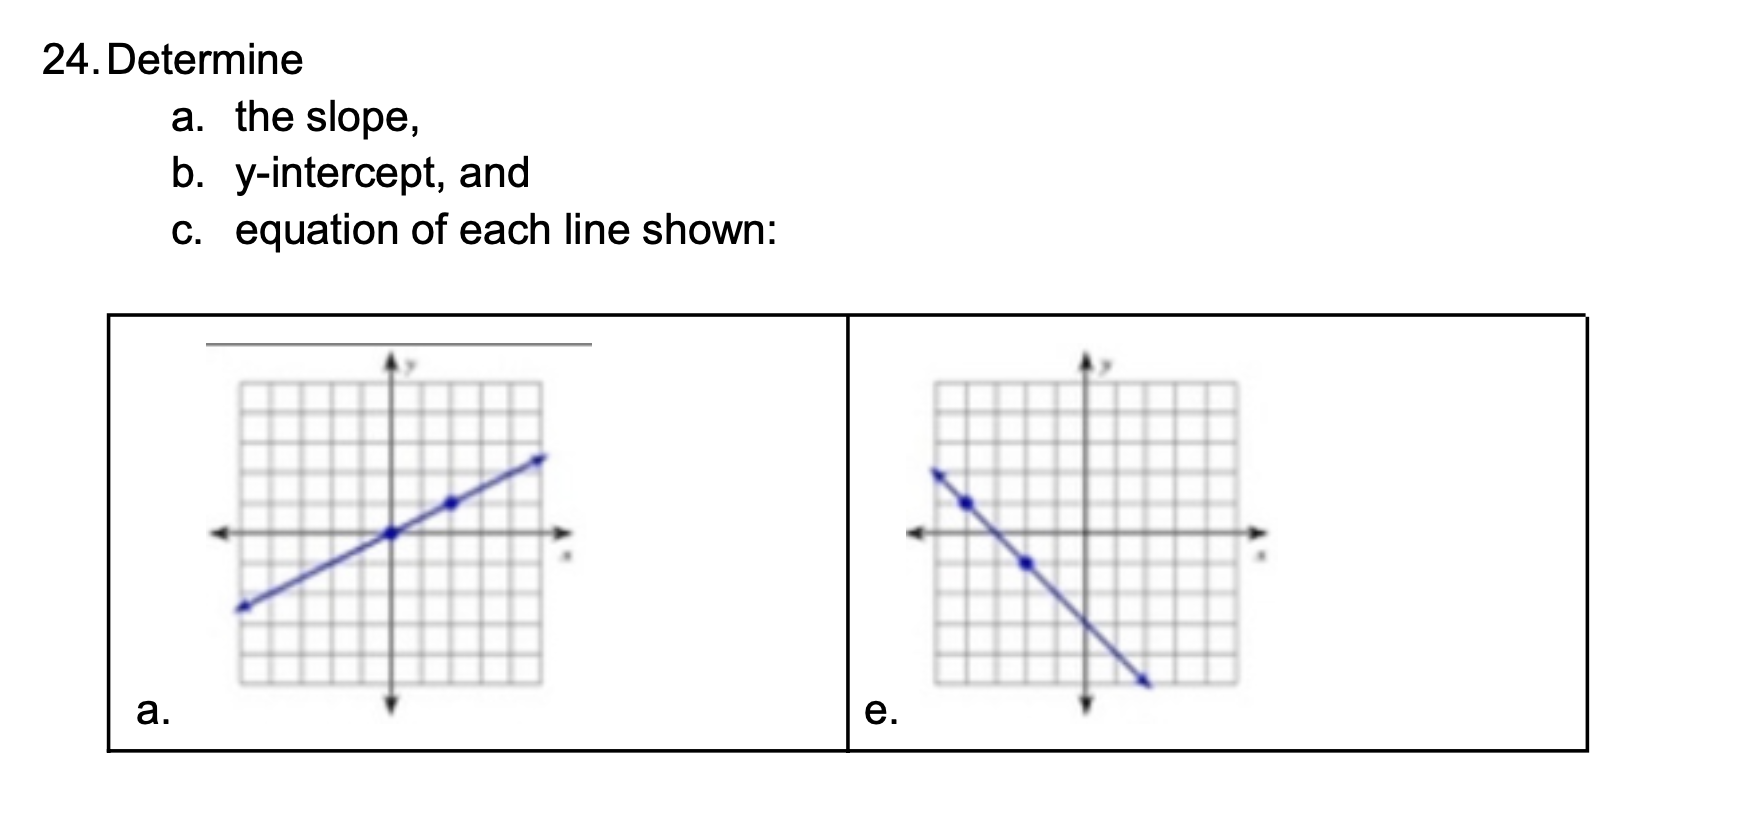
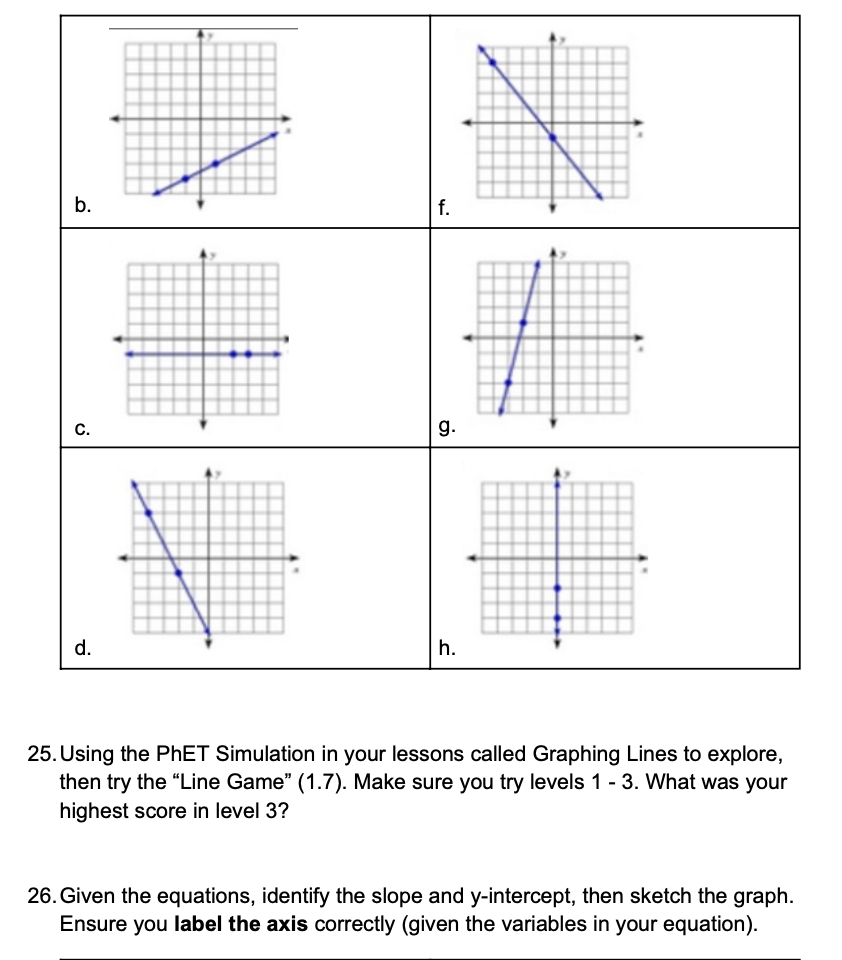
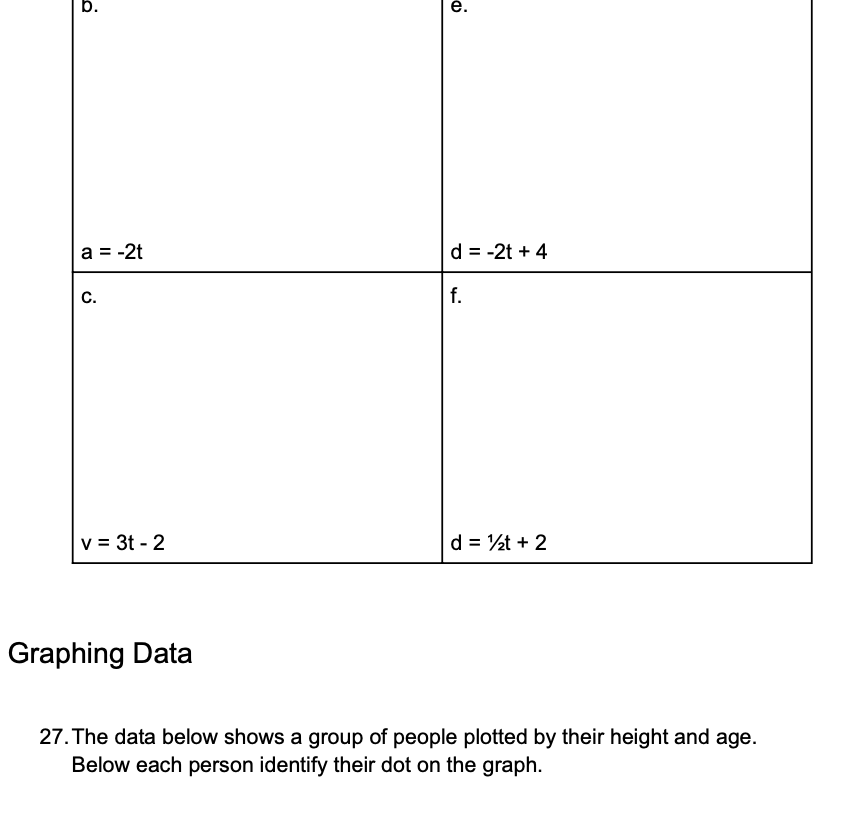
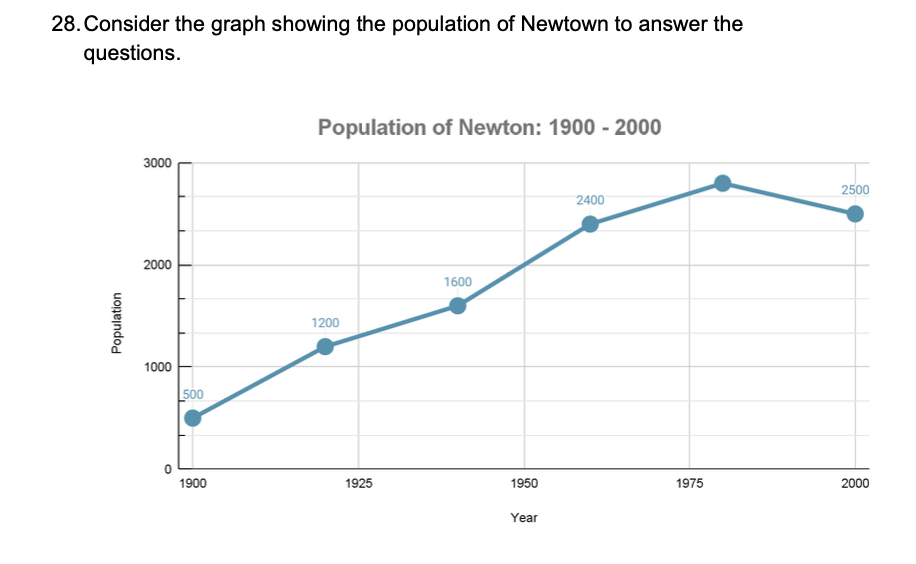
24. Determine a. the slope, b. y-intercept, and c. equation of each line shown: a. e.25.Using the PhET Simulation in your lessons called Graphing Lines to explore, then try the \"Line Game\" (1.7). Make sure you try levels 1 - 3. What was your highest score in level 3? 26.Given the equations, identify the slope and y-intercept, then sketch the graph. Ensure you label the axis correctly (given the variables in your equation). a=-2t d=-2t+4 Graphing Data 27.The data below shows a group of people plotted by their height and age. Below each person identify their dot on the graph. 28.Consider the graph showing the population of Newtown to answer the questions. Population of Newton: 1900 - 2000 Population 1900 1525 1950 19?5 2000 Year
Step by Step Solution
There are 3 Steps involved in it

Get step-by-step solutions from verified subject matter experts