

Question: PHYSICS 11/20 Unit 1 ~ Learning Guide Name: Instructions: WCLN.ca Using a pencil, complete the following notes as you work through the related lessons.
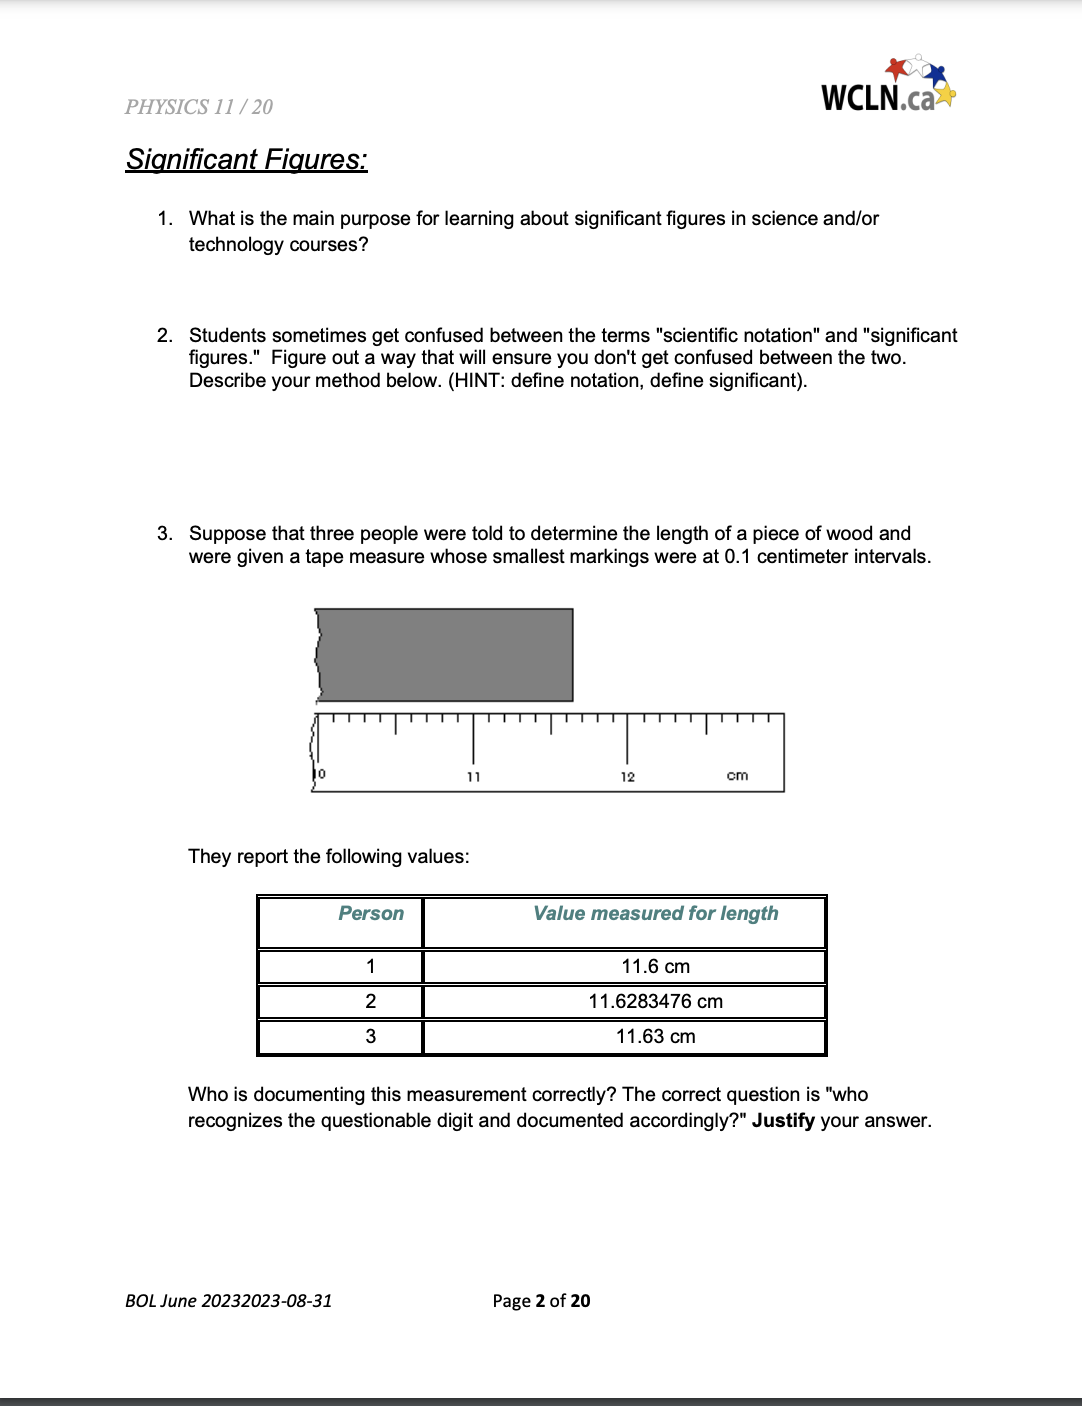
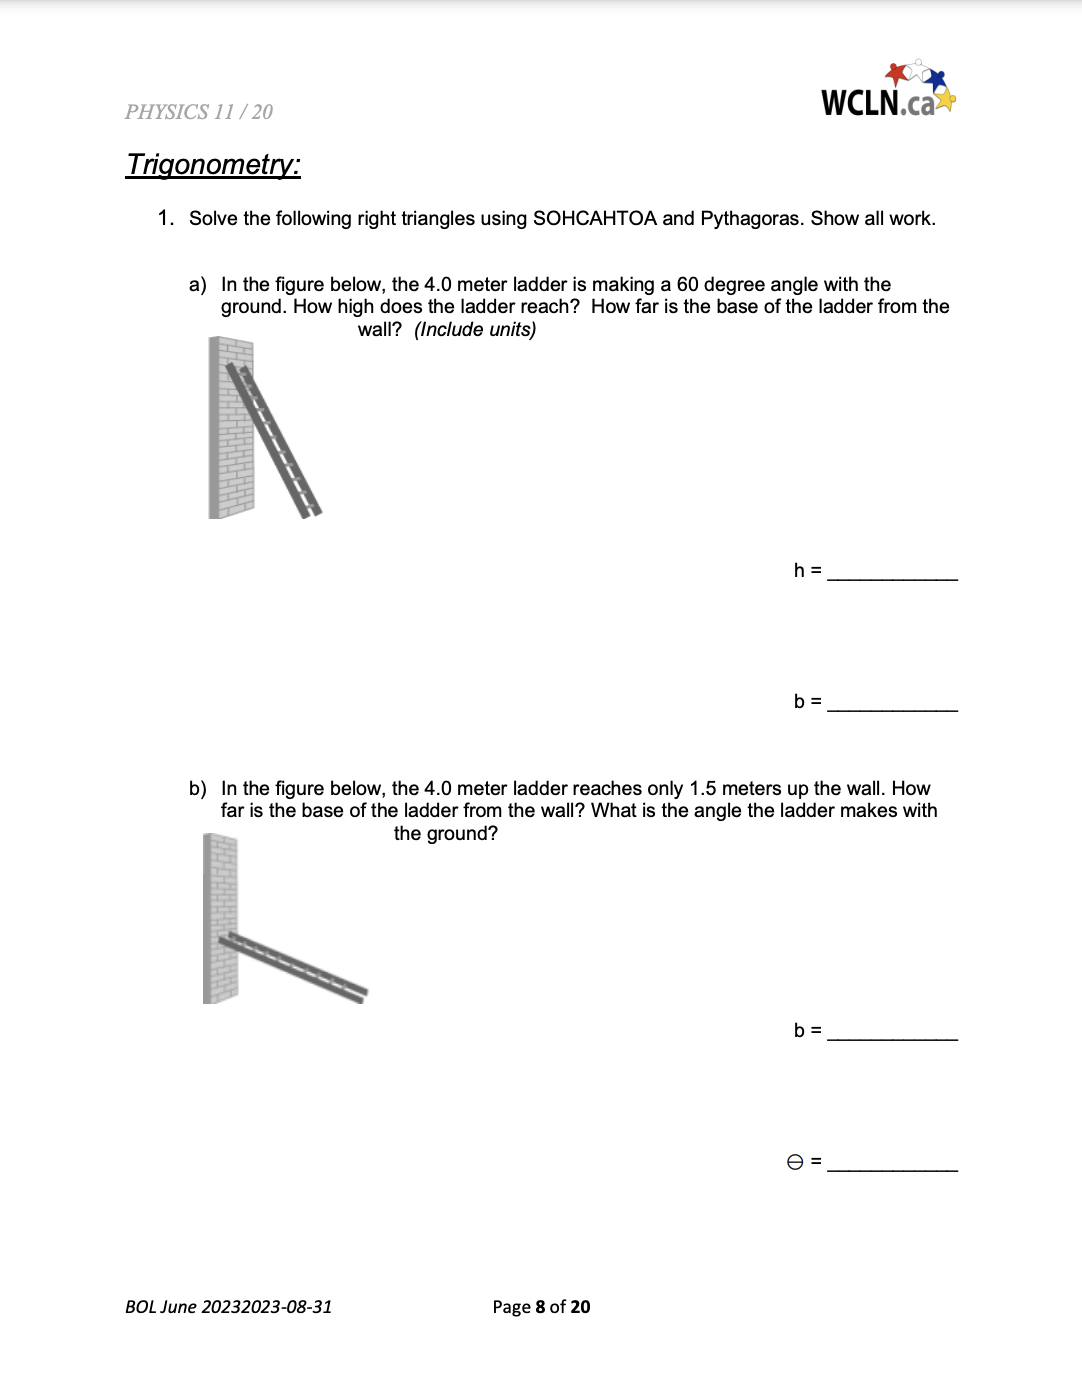
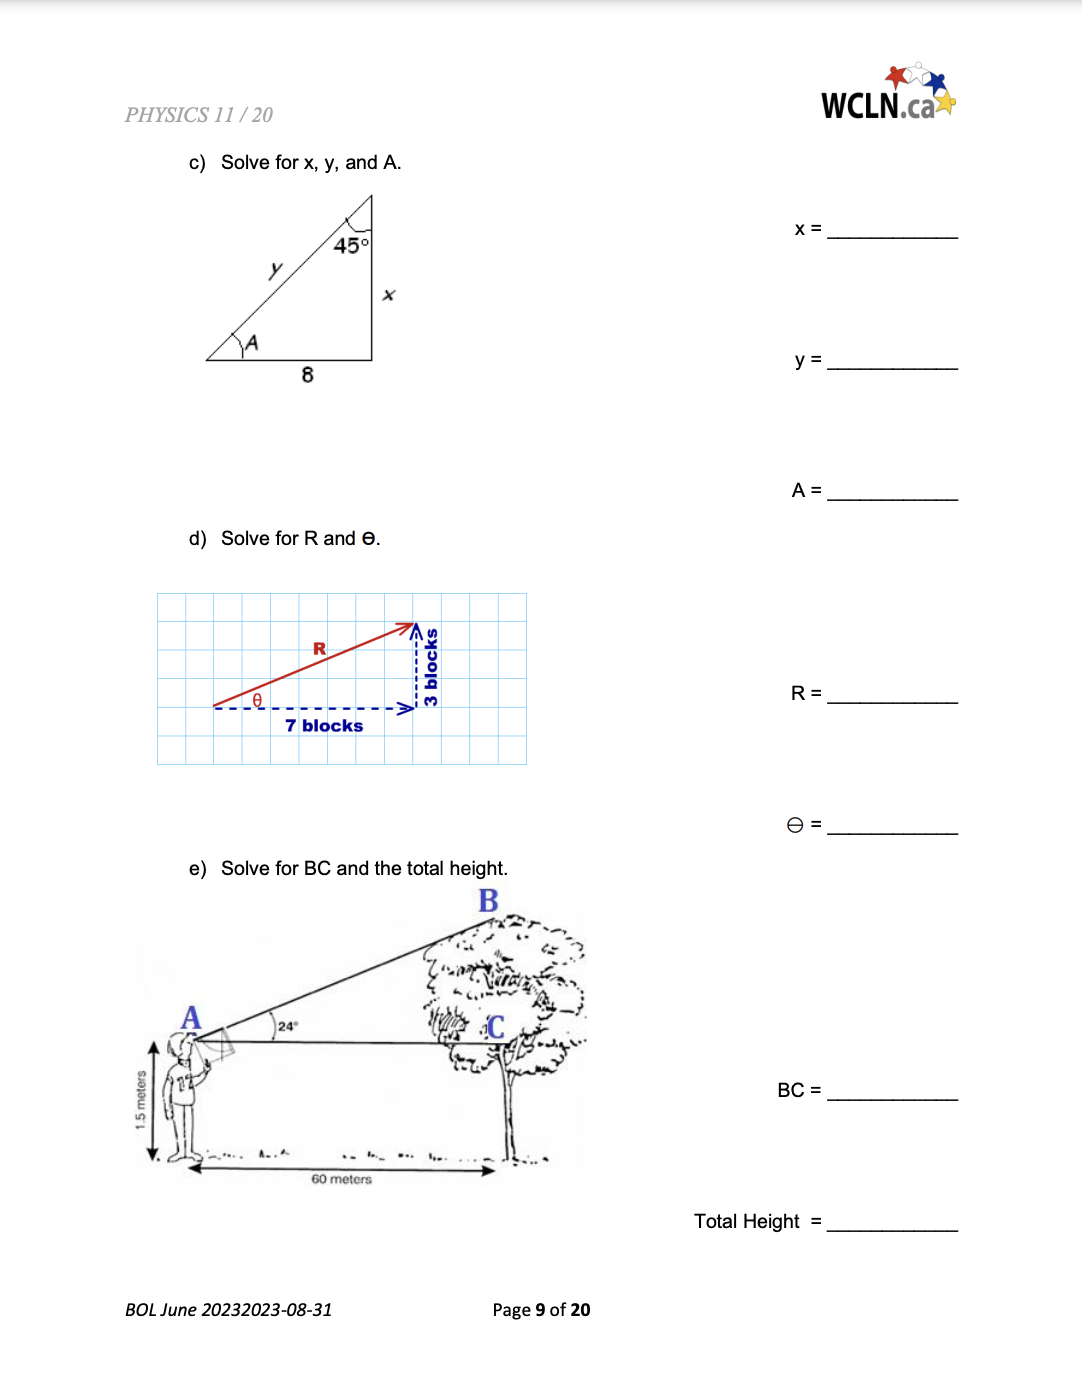
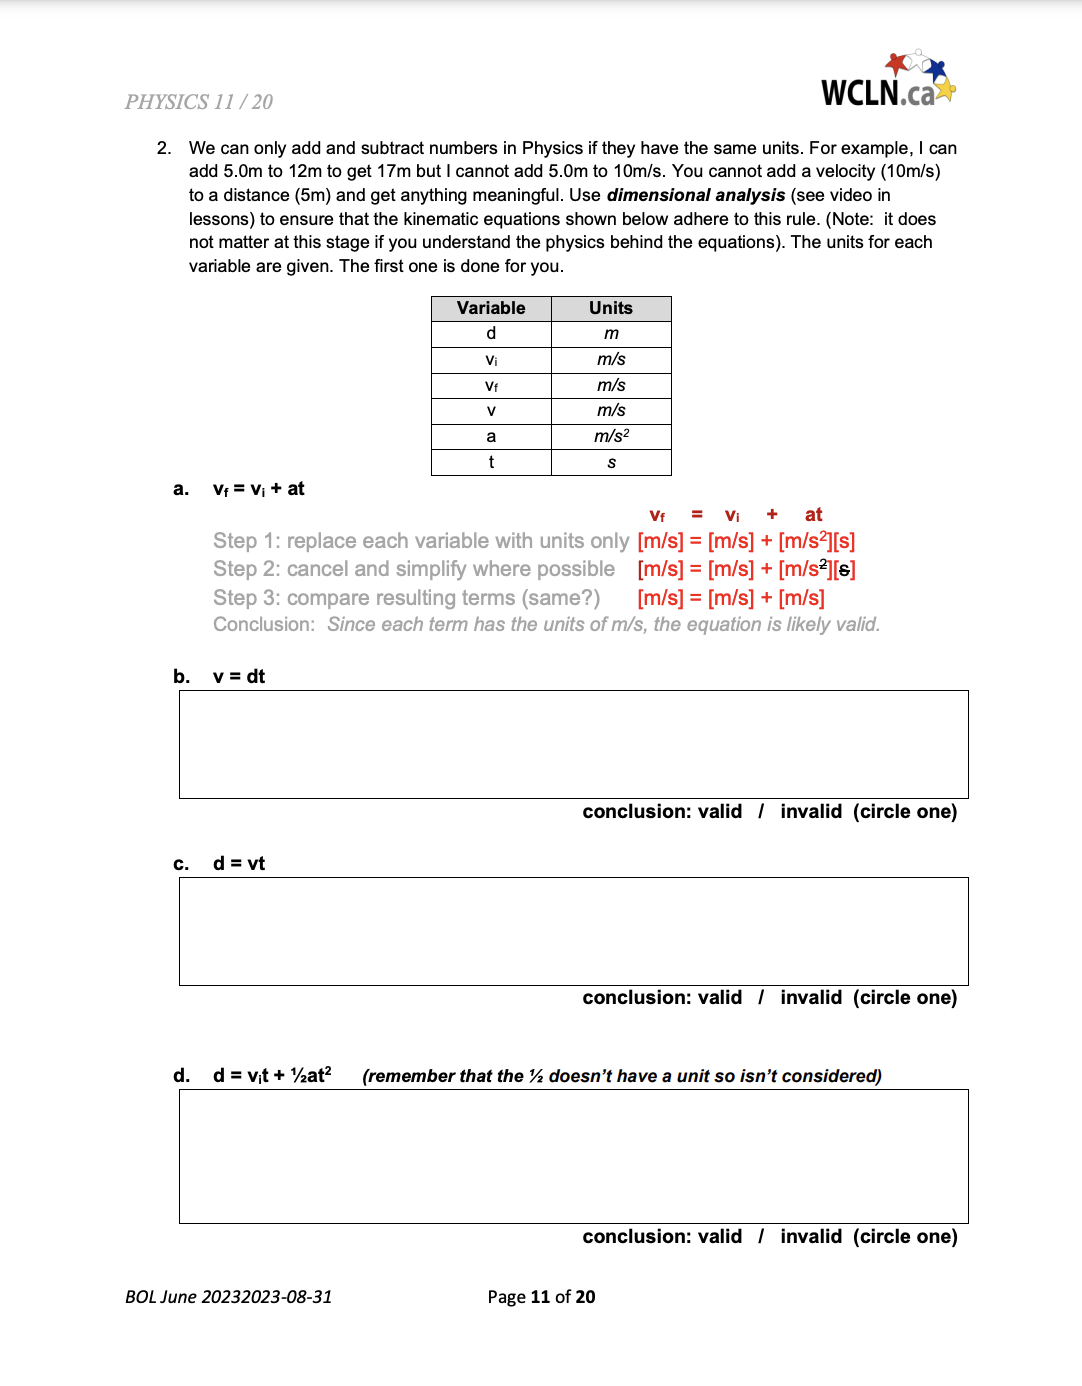
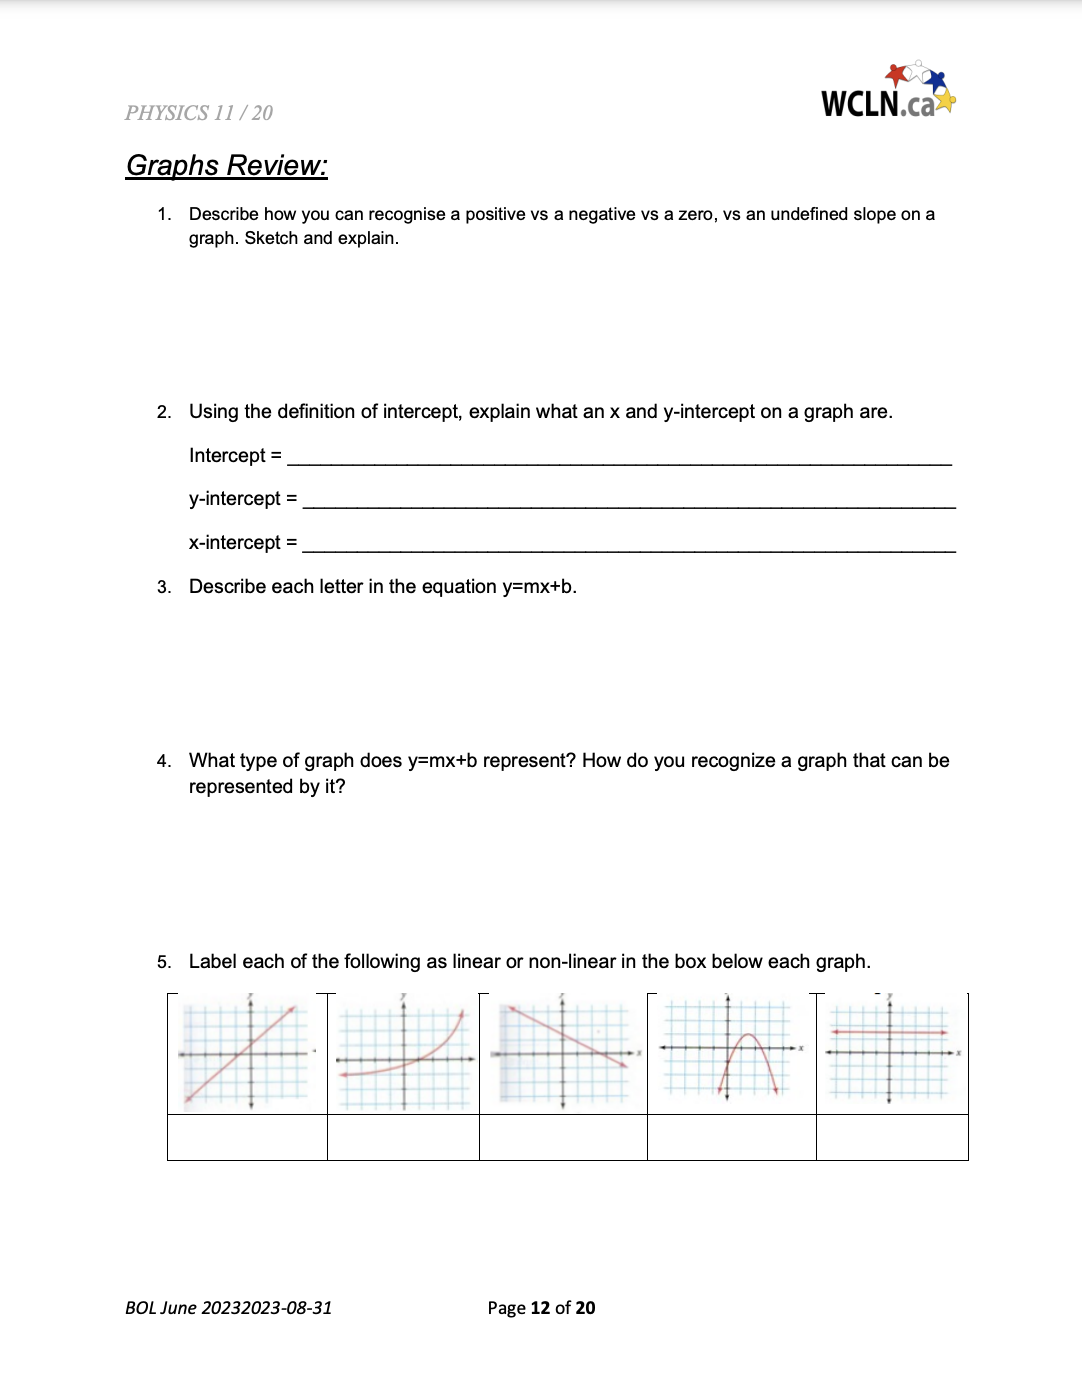
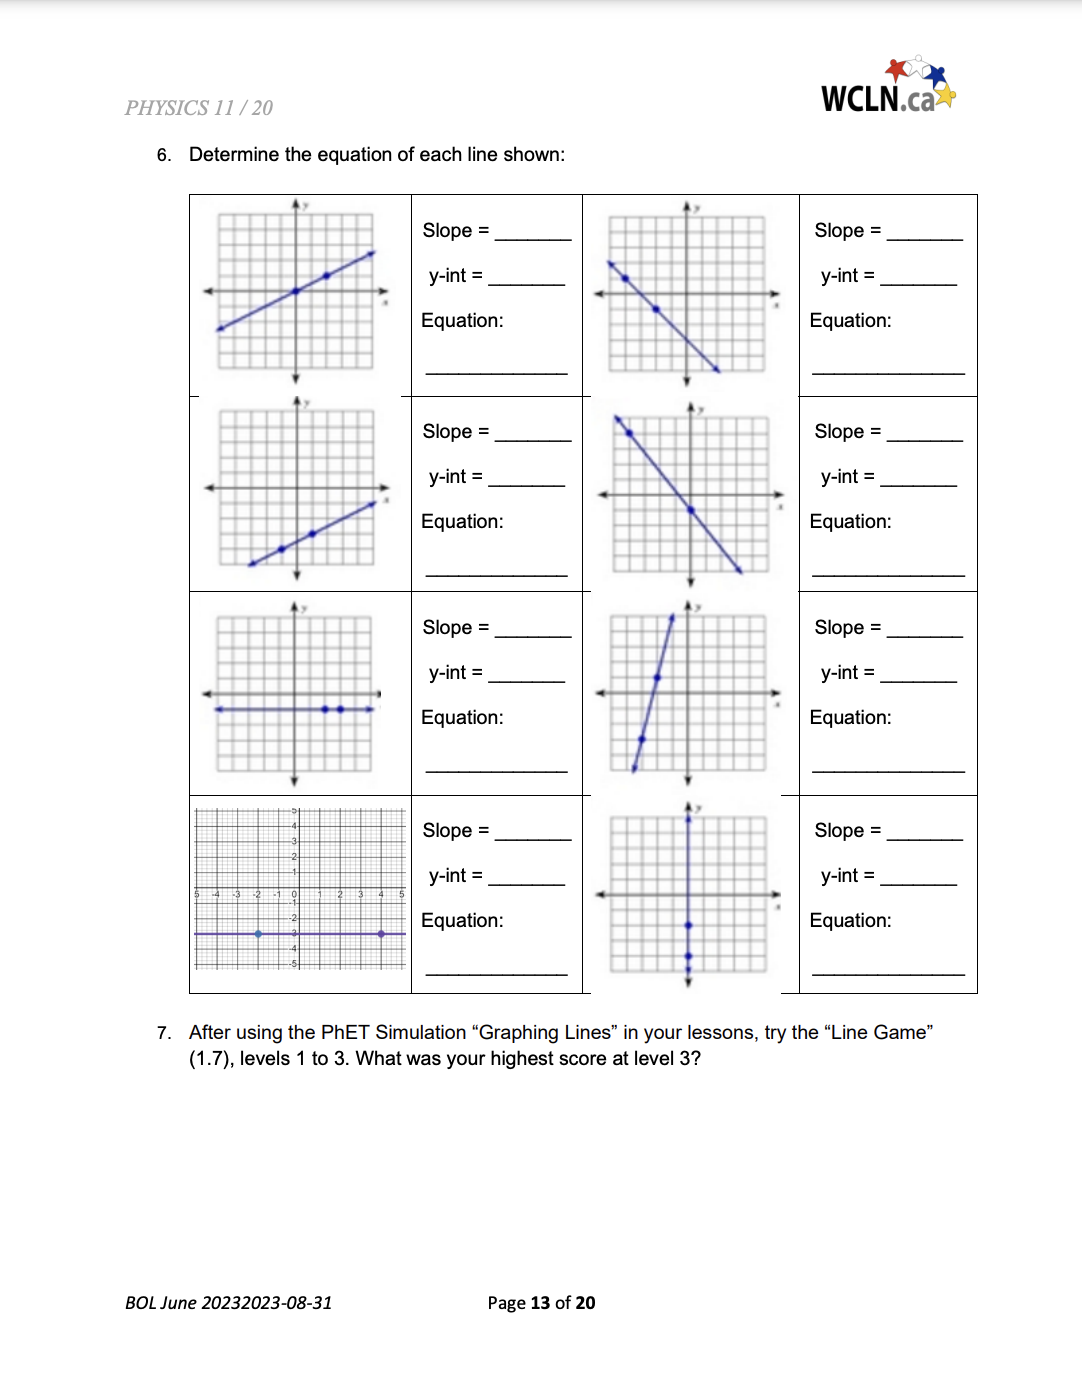
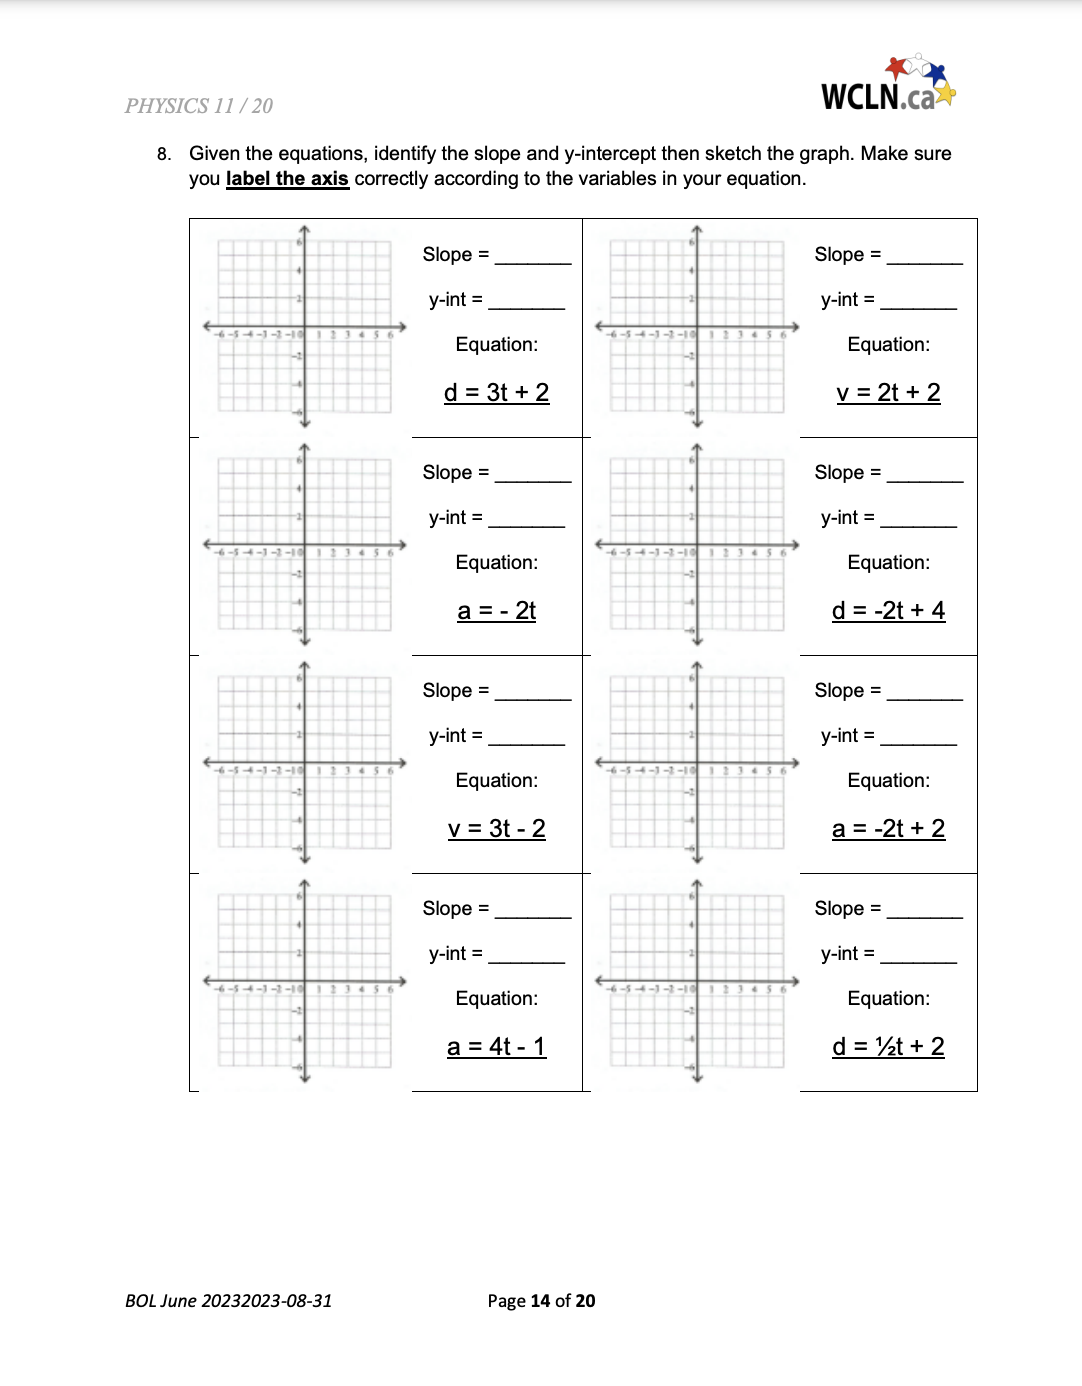
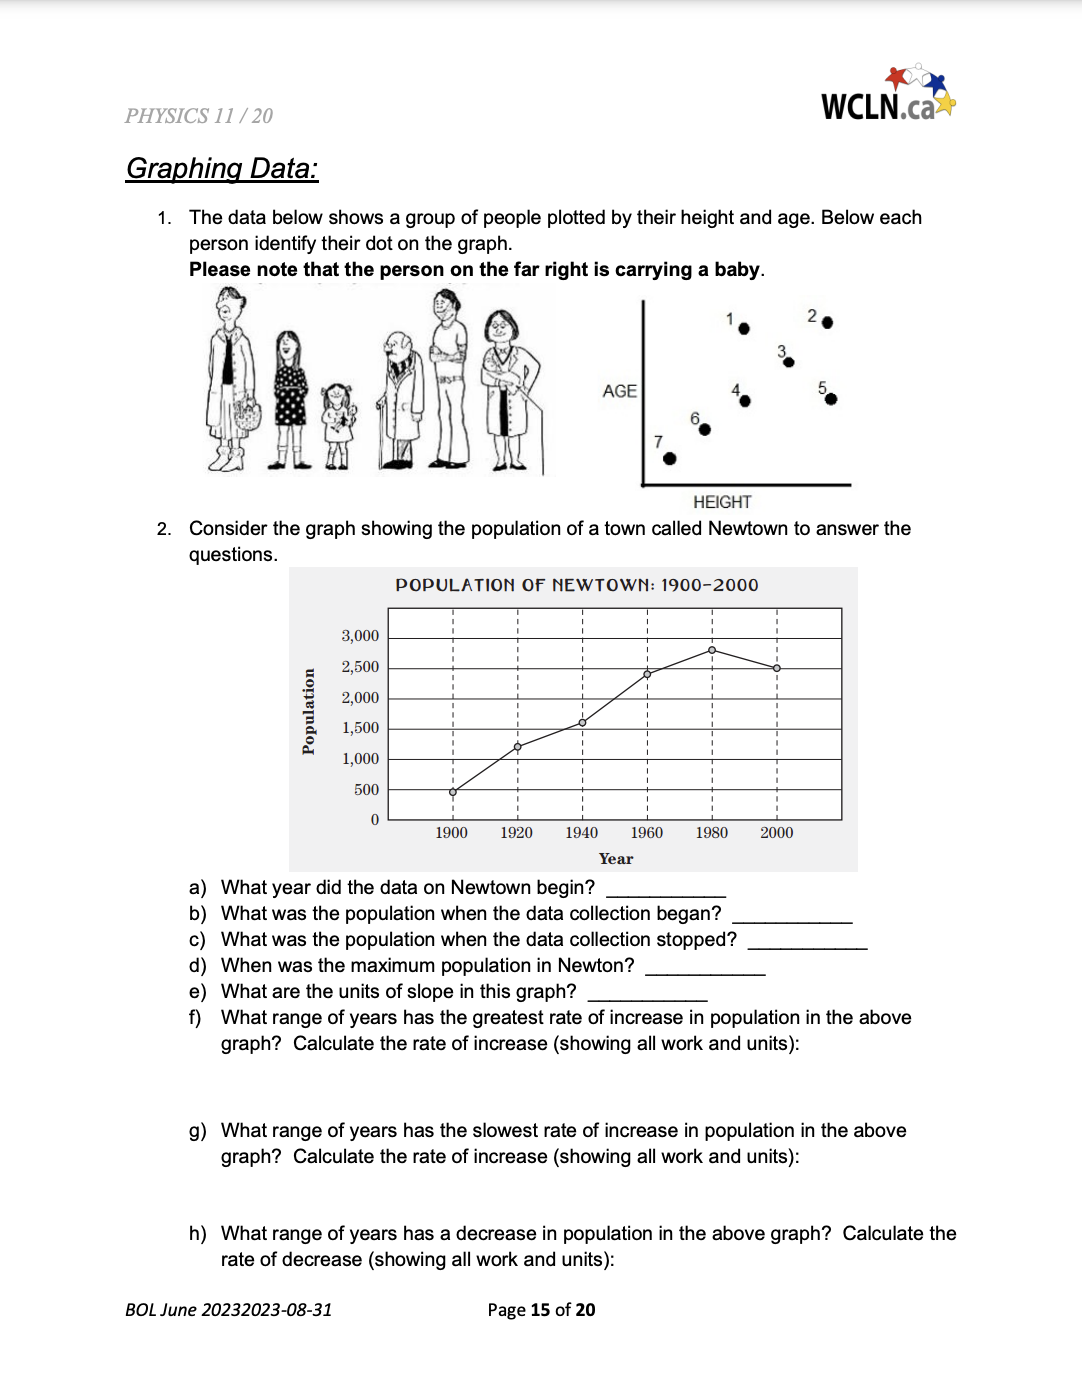
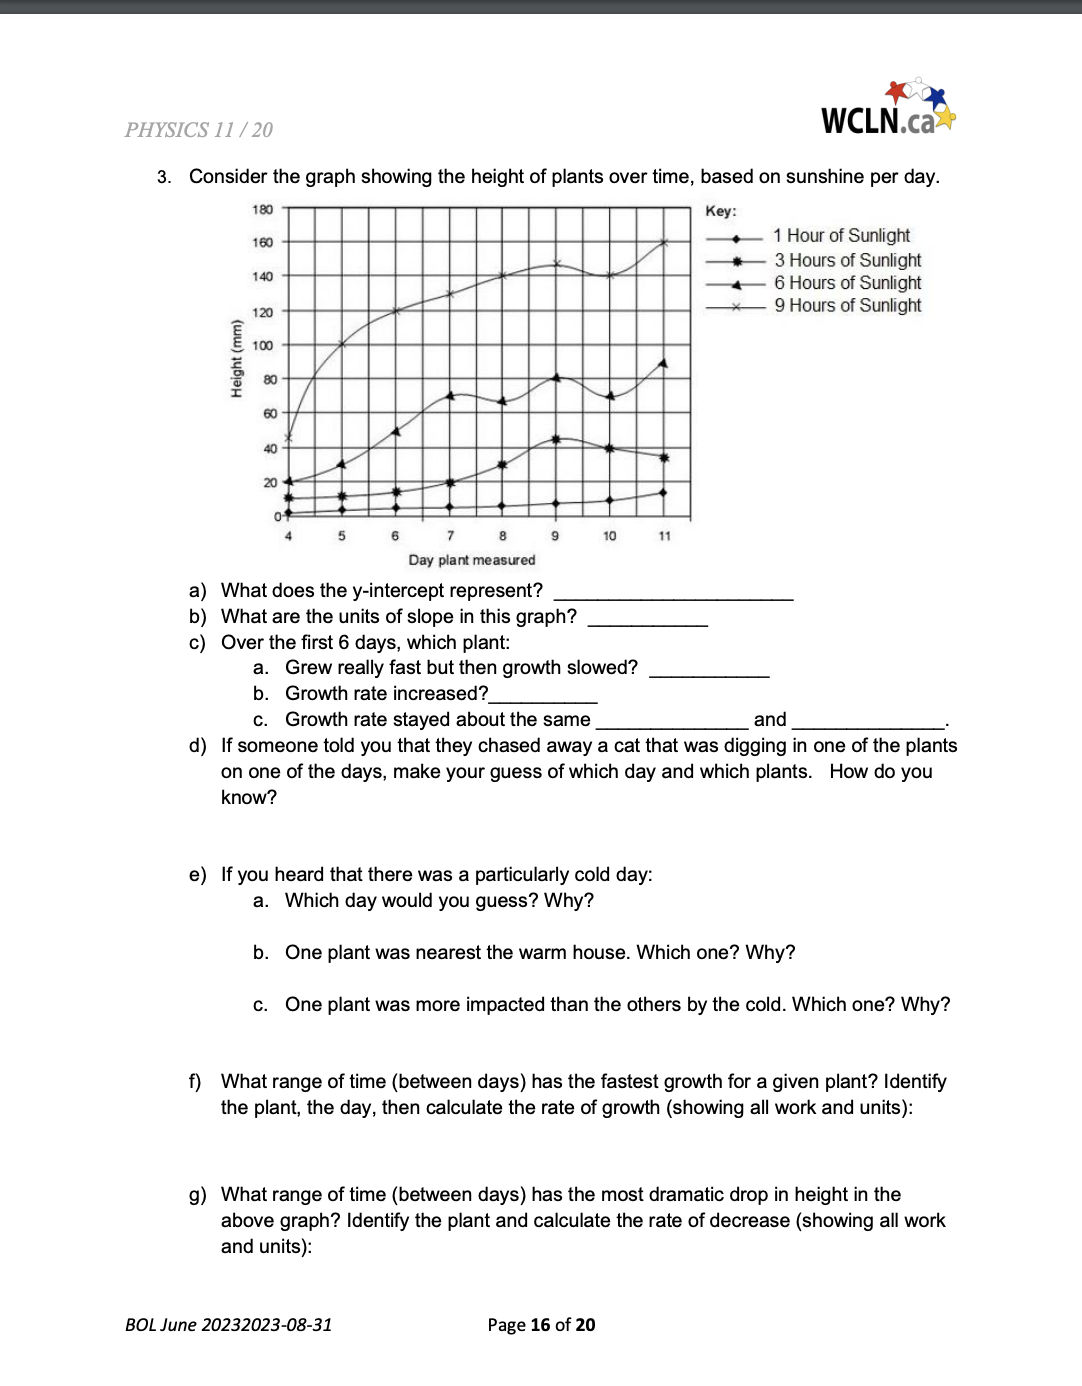
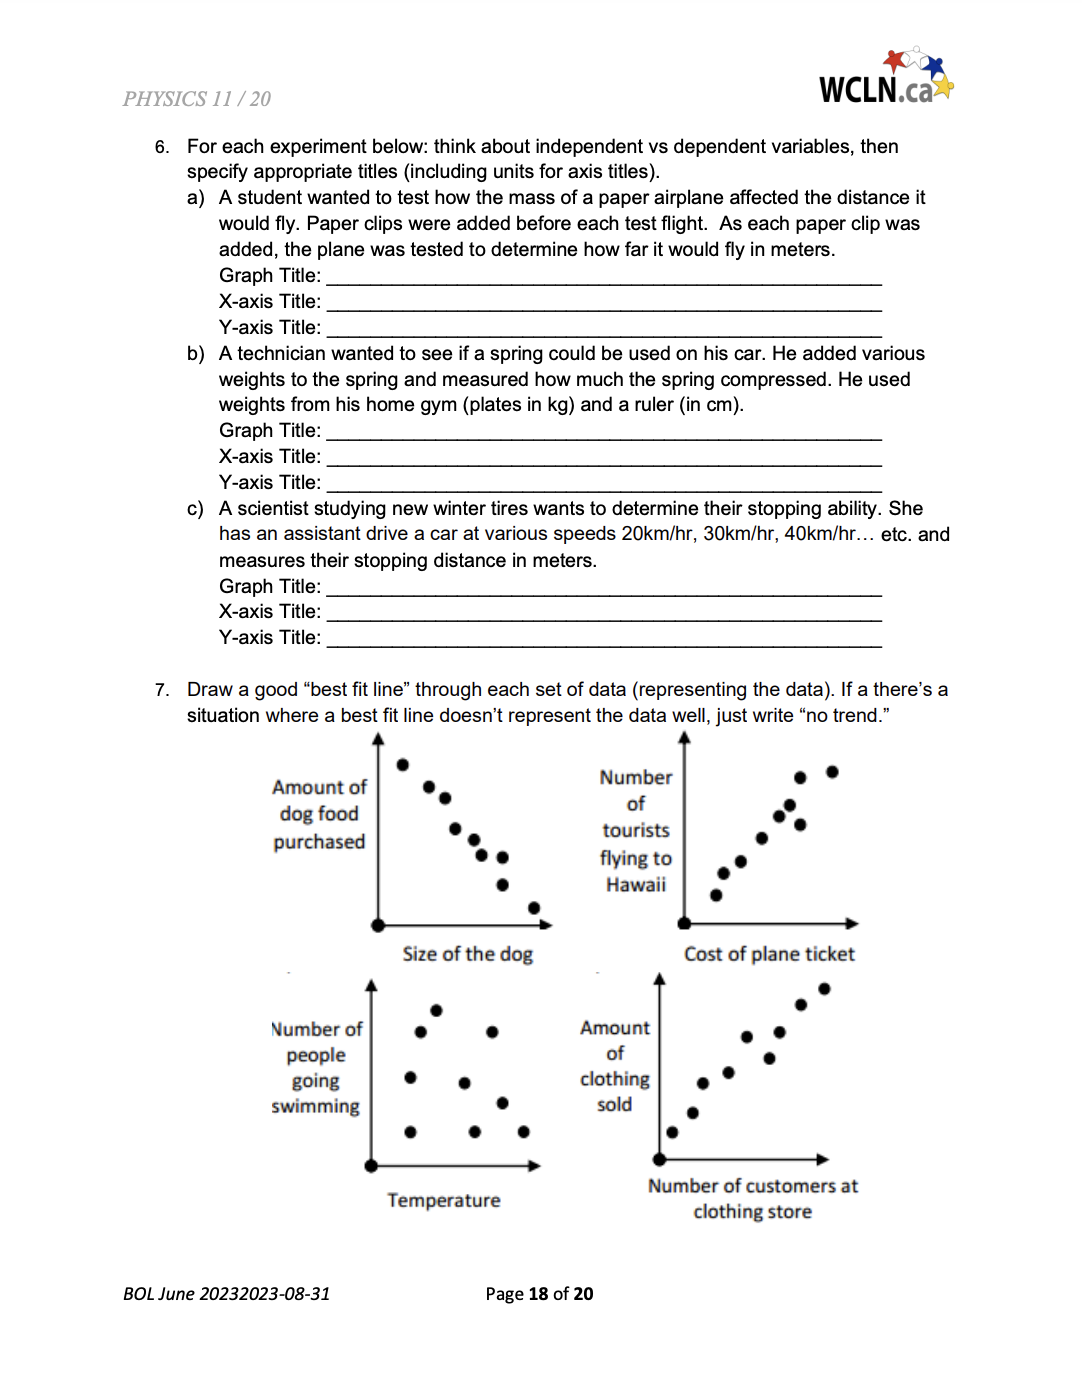
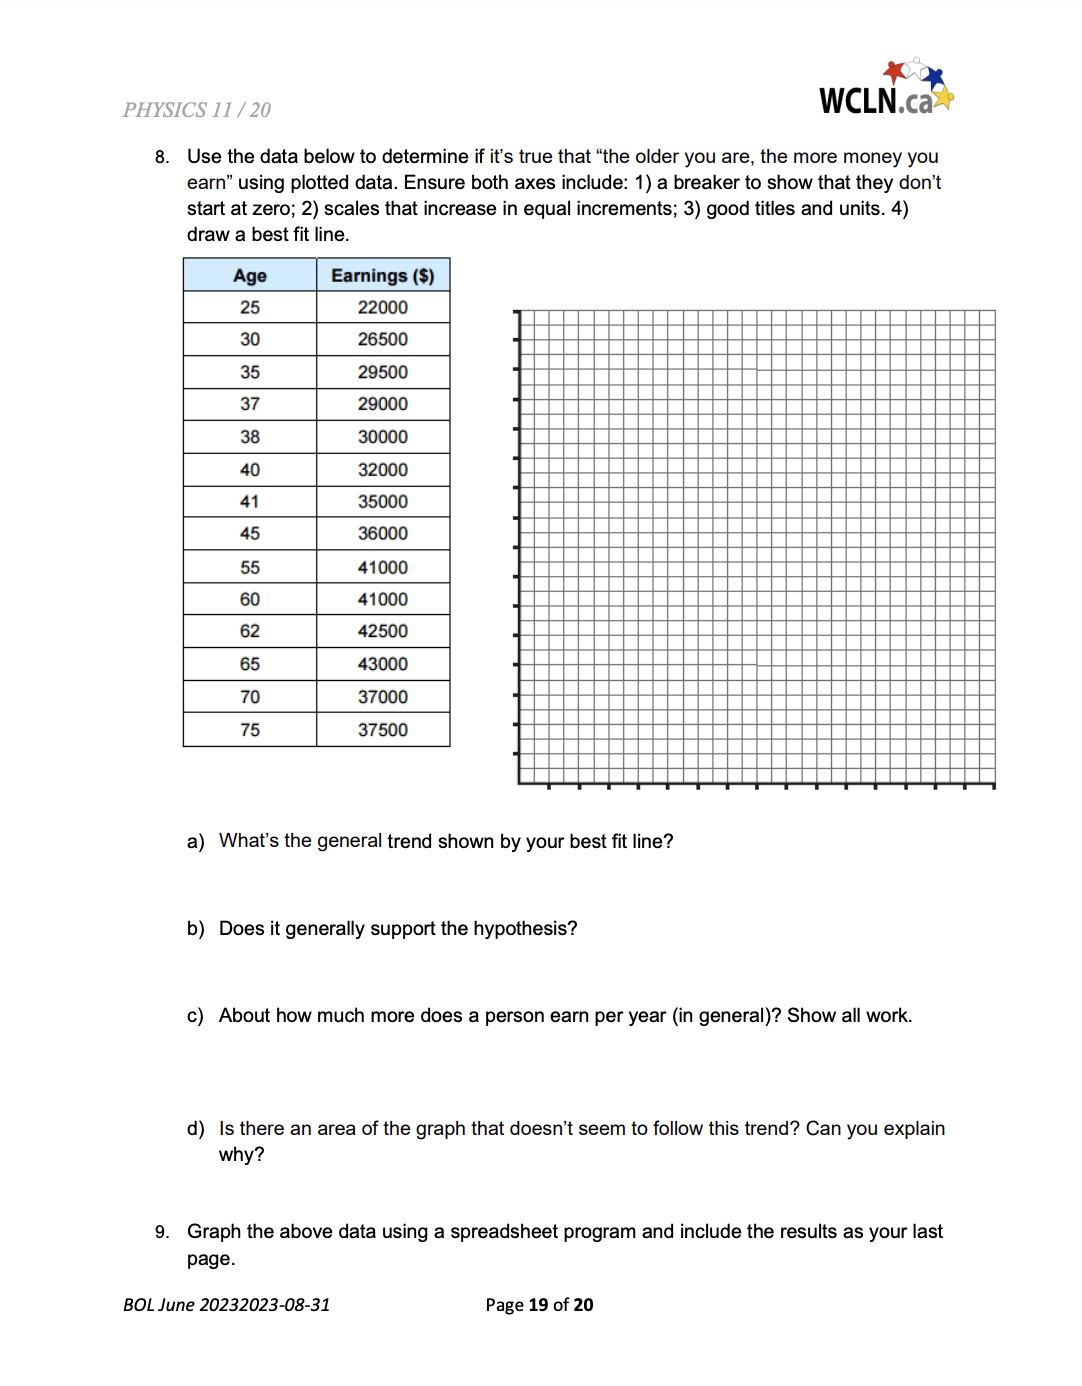

PHYSICS 11/20 Unit 1 ~ Learning Guide Name: Instructions: WCLN.ca Using a pencil, complete the following notes as you work through the related lessons. Show ALL work as is explained in the lessons. You are required to have this package completed BEFORE you write your unit test. Do your best and ask questions if you don't understand anything! Scientific Notation: 1. What is the purpose of scientific notation? 2. Do an Internet or book search and find something in your universe that is represented by a REALLY small number. a) What is it that is being described? b) Show the value in scientific notation: c) Show the value in regular notation: 3. Do an Internet or book search and find something in your universe that is represented by a REALLY large number. a) What is it that is being described? b) Show the value in scientific notation: c) Show the value in regular notation: 4. Convert the following to scientific notation in standard form. a) 34674 b) .000235 c) -2300000 d) -.0000150 e) 0.00750 BOL June 20232023-08-31 Page 1 of 20 WCLN.ca PHYSICS 11/20 Significant Figures: 1. What is the main purpose for learning about significant figures in science and/or technology courses? 2. Students sometimes get confused between the terms "scientific notation" and "significant figures." Figure out a way that will ensure you don't get confused between the two. Describe your method below. (HINT: define notation, define significant). 3. Suppose that three people were told to determine the length of a piece of wood and were given a tape measure whose smallest markings were at 0.1 centimeter intervals. 11 12 cm They report the following values: Person 1 2 3 Value measured for length 11.6 cm 11.6283476 cm 11.63 cm Who is documenting this measurement correctly? The correct question is "who recognizes the questionable digit and documented accordingly?" Justify your answer. BOL June 20232023-08-31 Page 2 of 20 PHYSICS 11/20 WCLN.ca 4. Round the following to the number of figures shown and convert to scientific notation in standard form. a) 634000 round to 2 sig figs b) 0.00345 round to 2 sig figs c) 298.76 round to 1 sig figs 5. Indicate the number of significant figures in the number given. a) 120000 b) 32100.0 c) .00123 d) 0.20040 e) 730.01 f) 0.0300 g) 7.590 x 10³ h) 9 x 10⁻⁴ 6. Ensure you can use your calculator to easily acquire the given results (use EE or EXP button if available). Include units. a. (5.98 x 1024 kg) (7.35 x 10 kg) = b. (5.98 x 1024 kg) / (7.35 x 10²² kg) BOL June 20232023-08-31 Page 3 of 20 PHYSICS 11/20 WCLN.ca 7. Evaluate the following and use the correct number of significant figures in your answer (Show all work and include units) a. 2.35 cm x 4.6 cm b. The formula for the volume of a sphere is V= -r. A student measured the radius to be r = 4.7 in, and they estimated to be 3.14159. Calculate the volume and round accordingly. V=r = (3.14159)(4.7in) = ? C. d) (-1.25m) (3.2m) 3.4m 33560000000x .00000012km 24.5hr e) 2301cm + 834.12cm + 9.0cm (12.3-2.98) f) 30.5s 8. Summarize the difference between the rules for significant figures when adding/subtracting and when multiplying/dividing. BOL June 20232023-08-31 Page 4 of 20 PHYSICS 11/20 Equation Solving: 1. Solve for x in the following equations (show all work): a. 2 = 5 + x b. 19 2x+7 c. 3 5x 14 WCLN.ca d. 5 = 1/2 2. Rearrange the equation, solving for the variable shown (clearly show all steps). a. Solve for "Q" where F = kQQ b. Solve for "t" where d = at BOL June 20232023-08-31 Page 5 of 20 PHYSICS 11/20 C. Solve for "Vo" where d = 2 d. Solve for "a" where v = vi + 2ad e. Solve for "d" where v = d - d t - t f. Solve for "m" where E, mgh g. Solve for "m" where E, = 12 my 2 BOL June 20232023-08-31 Page 6 of 20 WCLN.ca PHYSICS 11/20 d-d h. Solve for "ti" where v = t - t t + 1 at i. Solve for "Vo" where d=vt+ j. Solve for "vi" where v = v + 2ad d = (v + v/ ) V 2 k. Solve for "V" where d = I. Solve for "V" where E = 1 mv BOL June 20232023-08-31 Page 7 of 20 WCLN.ca PHYSICS 11/20 Trigonometry: WCLN.ca 1. Solve the following right triangles using SOHCAHTOA and Pythagoras. Show all work. a) In the figure below, the 4.0 meter ladder is making a 60 degree angle with the ground. How high does the ladder reach? How far is the base of the ladder from the wall? (Include units) h = b = b) In the figure below, the 4.0 meter ladder reaches only 1.5 meters up the wall. How far is the base of the ladder from the wall? What is the angle the ladder makes with the ground? BOL June 20232023-08-31 Page 8 of 20 b = 1.5 meters PHYSICS 11/20 c) Solve for x, y, and A. 8 45 d) Solve for R and e. 7 blocks 3 blocks e) Solve for BC and the total height. 24 A.. 60 meters BOL June 20232023-08-31 Page 9 of 20 BC = Total Height= R = x= y = A = WCLN.ca PHYSICS 11/20 Units of Measure: WCLN.ca 1. Unit conversions (show all work - lay out in brackets and cancel units, as in lesson examples) a. 2.67 kg to g b. 80.0 km/hr to m/s C. 34 km into meters d. 12 hours 26 minutes into seconds e. 1.0 day into seconds f. 100 km/hr into m/s g. 40 km/hr into m/s h. -1.2 m/s into km/hr i. 200 g into kg j. 10 kg into grams BOL June 20232023-08-31 Page 10 of 20 PHYSICS 11/20 WCLN.ca 2. We can only add and subtract numbers in Physics if they have the same units. For example, I can add 5.0m to 12m to get 17m but I cannot add 5.0m to 10m/s. You cannot add a velocity (10m/s) to a distance (5m) and get anything meaningful. Use dimensional analysis (see video in lessons) to ensure that the kinematic equations shown below adhere to this rule. (Note: it does not matter at this stage if you understand the physics behind the equations). The units for each variable are given. The first one is done for you. Units a. V = V + at Variable d m Vi m/s Vf m/s V m/s a m/s t S Vf = Vi + at Step 1: replace each variable with units only [m/s] = [m/s] + [m/s][s] Step 2: cancel and simplify where possible Step 3: compare resulting terms (same?) Conclusion: Since each term has the units of m/s, the equation is likely valid. [m/s] = [m/s] + [m/s][s] [m/s] = [m/s] + [m/s] b. v = dt conclusion: valid / invalid (circle one) C. d = vt d. d = vit + 1/2at conclusion: valid / invalid (circle one) (remember that the doesn't have a unit so isn't considered) conclusion: valid / invalid (circle one) BOL June 20232023-08-31 Page 11 of 20 PHYSICS 11/20 WCLN.ca Graphs Review: 1. Describe how you can recognise a positive vs a negative vs a zero, vs an undefined slope on a graph. Sketch and explain. 2. Using the definition of intercept, explain what an x and y-intercept on a graph are. Intercept = y-intercept = x-intercept = 3. Describe each letter in the equation y=mx+b. 4. What type of graph does y=mx+b represent? How do you recognize a graph that can be represented by it? 5. Label each of the following as linear or non-linear in the box below each graph. BOL June 20232023-08-31 Page 12 of 20 PHYSICS 11/20 6. Determine the equation of each line shown: Slope = y-int = Equation: " WCLN.ca Slope = y-int = Equation: Slope = Slope = y-int = y-int = Equation: Equation: Slope = Slope = y-int = y-int = Equation: Equation: Slope = Slope = y-int = y-int = Equation: Equation: 7. After using the PhET Simulation "Graphing Lines" in your lessons, try the "Line Game" (1.7), levels 1 to 3. What was your highest score at level 3? BOL June 20232023-08-31 Page 13 of 20 PHYSICS 11/20 WCLN.ca 8. Given the equations, identify the slope and y-intercept then sketch the graph. Make sure you label the axis correctly according to the variables in your equation. Slope = y-int = Slope = y-int = Equation: d = 3t+2 Equation: v = 2t+2 Slope = y-int = Equation: a = -2t Slope = y-int = Equation: d = -2t+4 Slope = y-int = Equation: v = 3t-2 Slope = y-int = Equation: a = 4t - 1 BOL June 20232023-08-31 Page 14 of 20 Slope = y-int = Equation: a = -2t+2 -2-10 Slope = y-int = Equation: d = 1/2t+2 PHYSICS 11/20 WCLN.ca Graphing Data: 1. The data below shows a group of people plotted by their height and age. Below each person identify their dot on the graph. Please note that the person on the far right is carrying a baby. AGE HEIGHT 2 2. Consider the graph showing the population of a town called Newtown to answer the questions. Population POPULATION OF NEWTOWN: 1900-2000 3,000 2,500 2,000 1,500 1,000 500 0 1900 1920 1940 1960 1980 2000 Year a) What year did the data on Newtown begin? b) What was the population when the data collection began? c) What was the population when the data collection stopped? d) When was the maximum population in Newton? e) What are the units of slope in this graph? f) What range of years has the greatest rate of increase in population in the above graph? Calculate the rate of increase (showing all work and units): g) What range of years has the slowest rate of increase in population in the above graph? Calculate the rate of increase (showing all work and units): h) What range of years has a decrease in population in the above graph? Calculate the rate of decrease (showing all work and units): BOL June 20232023-08-31 Page 15 of 20 PHYSICS 11/20 WCLN.ca 3. Consider the graph showing the height of plants over time, based on sunshine per day. 180 160 Key: 1 Hour of Sunlight Height (mm) 140 120 100 80 60 40 20 0 5 6 7 8 9 10 11 Day plant measured 3 Hours of Sunlight 6 Hours of Sunlight 9 Hours of Sunlight a) What does the y-intercept represent? b) What are the units of slope in this graph? c) Over the first 6 days, which plant: a. Grew really fast but then growth slowed? b. Growth rate increased? C. Growth rate stayed about the same and d) If someone told you that they chased away a cat that was digging in one of the plants on one of the days, make your guess of which day and which plants. How do you know? e) If you heard that there was a particularly cold day: a. Which day would you guess? Why? b. One plant was nearest the warm house. Which one? Why? c. One plant was more impacted than the others by the cold. Which one? Why? f) What range of time (between days) has the fastest growth for a given plant? Identify the plant, the day, then calculate the rate of growth (showing all work and units): g) What range of time (between days) has the most dramatic drop in height in the above graph? Identify the plant and calculate the rate of decrease (showing all work and units): BOL June 20232023-08-31 Page 16 of 20 PHYSICS 11/20 WCLN.ca 4. Suppose that the water level of a river is 34 meters and that it is receding at a rate of 0.50 meters per day. a) Write an equation for the water level, L, after d days. b) What does the slope in this relationship represent? c) Determine the number of days it would take to reach 26 meters (show all work): d) Sketch a graph of this situation for 10 days (include titles and units for everything) 5. A plumber charges $25 for a service call plus $50 per hour of service. a) Write an equation in slope-intercept form for the cost, C, after h hours of service b) What does the slope in this relationship represent? c) Determine the number of hours it would take to reach a cost of $500 (show all work): d) Sketch a graph of this situation for 10 hours (include titles and units for everything) BOL June 20232023-08-31 Page 17 of 20 PHYSICS 11/20 WCLN.ca 6. For each experiment below: think about independent vs dependent variables, then specify appropriate titles (including units for axis titles). a) A student wanted to test how the mass of a paper airplane affected the distance it would fly. Paper clips were added before each test flight. As each paper clip was added, the plane was tested to determine how far it would fly in meters. Graph Title: X-axis Title: Y-axis Title: b) A technician wanted to see if a spring could be used on his car. He added various weights to the spring and measured how much the spring compressed. He used weights from his home gym (plates in kg) and a ruler (in cm). Graph Title: X-axis Title: Y-axis Title: c) A scientist studying new winter tires wants to determine their stopping ability. She has an assistant drive a car at various speeds 20km/hr, 30km/hr, 40km/hr... etc. and measures their stopping distance in meters. Graph Title: X-axis Title: Y-axis Title: 7. Draw a good "best fit line" through each set of data (representing the data). If a there's a situation where a best fit line doesn't represent the data well, just write "no trend." Amount of dog food Number of purchased Number of people going swimming BOL June 20232023-08-31 Size of the dog Temperature tourists flying to Hawaii Amount of clothing sold Page 18 of 20 Cost of plane ticket Number of customers at clothing store PHYSICS 11/20 WCLN.ca 8. Use the data below to determine if it's true that "the older you are, the more money you earn" using plotted data. Ensure both axes include: 1) a breaker to show that they don't start at zero; 2) scales that increase in equal increments; 3) good titles and units. 4) draw a best fit line. Age Earnings ($) 25 22000 30 26500 35 29500 37 29000 38 30000 40 32000 41 35000 45 36000 55 41000 60 41000 62 42500 65 43000 70 37000 75 37500 a) What's the general trend shown by your best fit line? b) Does it generally support the hypothesis? c) About how much more does a person earn per year (in general)? Show all work. d) Is there an area of the graph that doesn't seem to follow this trend? Can you explain why? 9. Graph the above data using a spreadsheet program and include the results as your last page. BOL June 20232023-08-31 Page 19 of 20 PHYSICS 11/20 Science and Conspiracy Theories: WCLN.ca Refer to the beginning of the unit and consider the role of science before we push forward. 1. Briefly describe the scientific method (in your own words). How does this help us have confidence in scientific findings? 2. Provide some ideas (in your own words) on how you can recognize pseudoscience & conspiracy theories when it's being presented as science? 3. Briefly describe a reason why an individual, a company, and a country would each start spreading a conspiracy theory as truth. Person: Company (industry): Country: BOL June 20232023-08-31 Page 20 of 20
Step by Step Solution
There are 3 Steps involved in it
1 What is the purpose of scientific notation Answer The purpose of scientific notation is to express very large or very small numbers in a concise and manageable form It makes it easier to work with t... View full answer

Get step-by-step solutions from verified subject matter experts