Question: 242 Chapter Eight Chapter 8 Homework Exercises Directions: Complete questions 1-5 in Excel and paste the answers into a word processing program. The data for
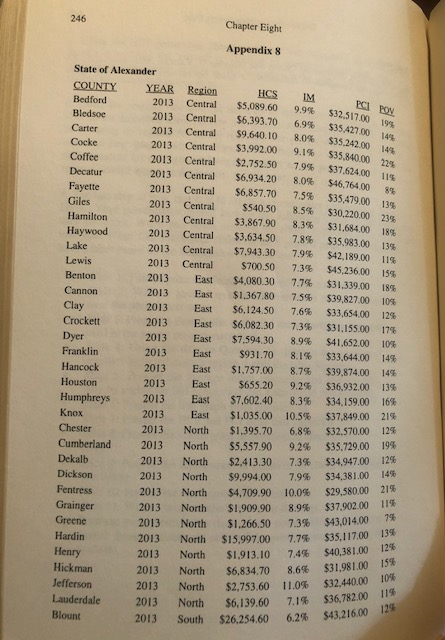
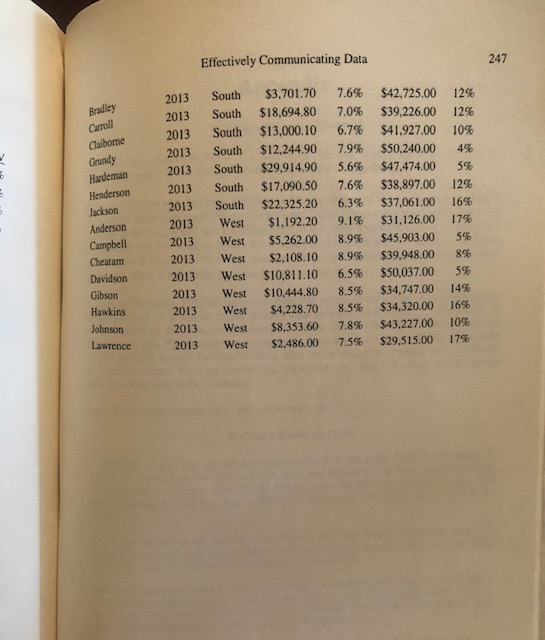
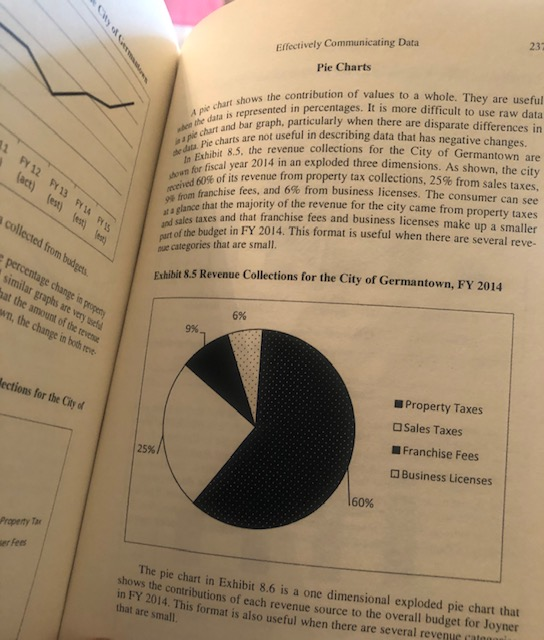
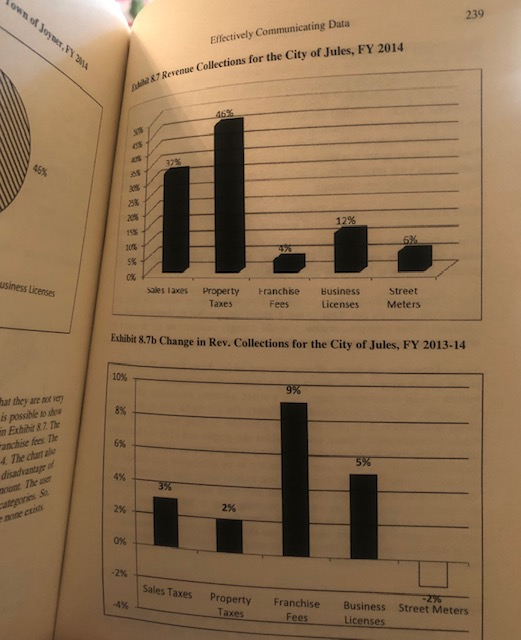
242 Chapter Eight Chapter 8 Homework Exercises Directions: Complete questions 1-5 in Excel and paste the answers into a word processing program. The data for questions 1-5 are located in the appendix to chapter 8. Question six should be printed out in power point. Make sure that you check to ensure that your charts and figures correspond with the actual data. Background Information: Governor Rebecca Davis is preparing her state of the state address and wants to focus on poverty and infant mortality issues. As a result, she has contacted you, state vital statistics director, to provide data on poverty and infant mortality in the state's 50 counties. More specifically, she wants you to determine if there is a link between poverty and income and be tween health care spending and infant mortality in the different regions of the state. Using the county level data in the Excel spreadsheet, complete the follow- ing tasks. 1a. Create a three dimensional pie chart showing the percentage (round to whole number) of the counties that represent each region (Central, East, North, South, and West) in the data. Label the chart Regions A. See Exhibit 8.5. b. Using the county data in the Excel spreadsheet, create at bar graph showing the number of counties that represent each region in the state. Label the chart Regions B. See Exhibit 8.7. c. Which one of these techniques best describes/visually represent the data? 246 Chapter Eight Appendix 8 PCI PON $32.517.00 195 $35.427.00 $35.242.00 146 $35.840.00 229 $37.624.00 119 $46,764,00 $35.479.00 138 $30,220.00 239 $31,684,00 183 $35.983.00 13% $42.189.00 $45.236.00 $31.339.00 $39.827.00 104 $33.654.00 17% 1596 184 State of Alexander COUNTY YEAR Bedford 2013 Bledsoe 2013 Carter 2013 Cocke 2013 Coffee 2013 Decatur 2013 Fayette 2013 Giles 2013 Hamilton 2013 Haywood 2013 Lake 2013 Lewis 2013 Benton 2013 Cannon 2013 2013 Crockett 2013 Dyer 2013 Franklin 2013 Hancock 2013 Houston 2013 Humphreys 2013 Knox 2013 Chester 2013 Cumberland 2013 Dekalb 2013 Dickson 2013 Fentress 2013 Grainger 2013 Greene 2013 Hardin 2013 Henry 2013 Hickman 2013 Jefferson 2013 Lauderdale 2013 Blount 2013 IM 9.99 6.99 8.0% 9.1% 7.99 8.09 7.5% 8.5% 8.3% 7.8% 7.98 7.39 7.7% 7.5% 7.6% 7.3% 8.9% 8.1% 8.75 9.25 8.3% 10.5% 6.8% Clay Region Central Central Central Central Central Central Central Central Central Central Central Central East East East East East East East East East East North North North North North North North North North North North North South HCS $5.089.60 $6.393.70 $9.640.10 $3.992.00 $2.752.50 $6,934.20 $6,857.70 $540.50 $3.867.90 $3,634.50 $7.943.30 $700.50 $4,080.30 $1.367.80 $6.124.50 $6,082.30 $7.594.30 $931.70 $1,757.00 $655.20 $7.602.40 $1.035.00 $1,395.70 $5.557.90 $2,413.30 $9.994.00 $4.709.90 $1.909.90 $1.266.50 $15.997.00 $1.913.10 $6,834.70 $2,753.60 $6,139.60 $26,254.60 12% $31.155.00 $41.652.00 10% $33.644.00 $39.874.00 1496 $36,932.00 13% $34.159.00 16% $37.849.00 219 $32.570.00 129 $35.729.00 19% $34.947.00 12% $34,381.00 9.2% 7.3% 7.9% 10.0% 8.9% 7.3% 7.7% 7.4% 8.6% 11.0% 7.1% 6.296 $29.580.00 219 $37.902.00 1198 $43.014.00 74 $35.117.00 139 $40,381.00 129 $31.981.00 154 $32.440.00 104 $36,782.00 119 $43,216.00 125 Effectively Communicating Data 247 Bradley Carroll Claibome Grundy Hardeman Henderson Jackson Anderson Campbell 2013 2013 2013 2013 2013 2013 2013 2013 2013 2013 2013 2013 2013 2013 2013 South South South South South South South West West West West West West West West $3,701.70 $18,694.80 $13,000.10 $12,244.90 $29,914.90 $17.090.50 $22,325.20 $1,192.20 $5.262.00 $2.108.10 $10,811.10 $10,444.80 $4,228.70 $8.353.60 $2,486.00 7.6% 7.0% 6.7% 7.9% 5.6% 7.6% 6.3% 9.1% 8.9% 8.9% 6.5% 8.5% 8.5% 7.8% 7.5% $42,725.00 $39,226.00 $41.927.00 $50,240.00 $47.474.00 $38,897.00 $37,061.00 $31.126.00 $45.903.00 $39.948.00 $50,037.00 $34,747.00 $34.320.00 $43.227.00 $29.515.00 12% 12% 10% 4% 5% 12% 16% 17% 5% 8% 5% 14% 16% 10% 17% Cheatam Davidson Gibson Hawkins Johnson Lawrence Apie chart shows the contribution of values to a whole. They are useful w the date is represented in percentages. It is more difficult to use raw data edot Pie charts are not useful in describing data that has negative changes. pe chat and bar graph, particularly when there are disparate differences in med 606 of its revenue from property tax collections, 25% from sales taxes, own for fiscal year 2014 in an exploded three dimensions. As shown, the city from franchise fees, and 696 from business licenses. The consumer can see ata place that the majority of the revenue for the city came from property taxes Le Exhibit 8.5. the revenue collections for the City of Germantown are Effectively Communicating Data 23 Pie Charts 1 P12 P13 PPS collected from badgets sed sales taxes and that franchise fees and business licenses make up a smaller part of the budget in FY 2014. This format is useful when there are several reve- ut categories that are small. e percentage change in property similar graphs are very well bat the amount of the teve Exhibit 8.5 Revenue Collections for the City of Germantown, FY 2014 wn, the change in both the 6% 9% Hections for the City of Property Taxes Sales Taxes |25% A Franchise Fees Business Licenses 160% Property The fees The pie chart in Exhibit 8.6 is a one dimensional exploded pie chart that shows the contributions of each revenue source to the overall budget for Joyner in FY 2014. This format is also useful when there are several revenue con that are small X7 Revenue Collections for the City of Jules, FY 2014 wewe, 239 Efectively Communicating Data 465 13 2015 12% 5% usiness Licenses Sales Taxes Property Taxes Franchise Fees Business Licenses Street Meters Exhibit 8.76 Change in Rev. Collections for the City of Jules, FY 2013-14 10% 9% hat they are not 8% is possible de in Ether. The 6% 5% The carte disadvantar 3% 2% 2% OX -2% Sales Taxes Property Taxes Franchise Fees Business Street Meters Licenses 242 Chapter Eight Chapter 8 Homework Exercises Directions: Complete questions 1-5 in Excel and paste the answers into a word processing program. The data for questions 1-5 are located in the appendix to chapter 8. Question six should be printed out in power point. Make sure that you check to ensure that your charts and figures correspond with the actual data. Background Information: Governor Rebecca Davis is preparing her state of the state address and wants to focus on poverty and infant mortality issues. As a result, she has contacted you, state vital statistics director, to provide data on poverty and infant mortality in the state's 50 counties. More specifically, she wants you to determine if there is a link between poverty and income and be tween health care spending and infant mortality in the different regions of the state. Using the county level data in the Excel spreadsheet, complete the follow- ing tasks. 1a. Create a three dimensional pie chart showing the percentage (round to whole number) of the counties that represent each region (Central, East, North, South, and West) in the data. Label the chart Regions A. See Exhibit 8.5. b. Using the county data in the Excel spreadsheet, create at bar graph showing the number of counties that represent each region in the state. Label the chart Regions B. See Exhibit 8.7. c. Which one of these techniques best describes/visually represent the data? 246 Chapter Eight Appendix 8 PCI PON $32.517.00 195 $35.427.00 $35.242.00 146 $35.840.00 229 $37.624.00 119 $46,764,00 $35.479.00 138 $30,220.00 239 $31,684,00 183 $35.983.00 13% $42.189.00 $45.236.00 $31.339.00 $39.827.00 104 $33.654.00 17% 1596 184 State of Alexander COUNTY YEAR Bedford 2013 Bledsoe 2013 Carter 2013 Cocke 2013 Coffee 2013 Decatur 2013 Fayette 2013 Giles 2013 Hamilton 2013 Haywood 2013 Lake 2013 Lewis 2013 Benton 2013 Cannon 2013 2013 Crockett 2013 Dyer 2013 Franklin 2013 Hancock 2013 Houston 2013 Humphreys 2013 Knox 2013 Chester 2013 Cumberland 2013 Dekalb 2013 Dickson 2013 Fentress 2013 Grainger 2013 Greene 2013 Hardin 2013 Henry 2013 Hickman 2013 Jefferson 2013 Lauderdale 2013 Blount 2013 IM 9.99 6.99 8.0% 9.1% 7.99 8.09 7.5% 8.5% 8.3% 7.8% 7.98 7.39 7.7% 7.5% 7.6% 7.3% 8.9% 8.1% 8.75 9.25 8.3% 10.5% 6.8% Clay Region Central Central Central Central Central Central Central Central Central Central Central Central East East East East East East East East East East North North North North North North North North North North North North South HCS $5.089.60 $6.393.70 $9.640.10 $3.992.00 $2.752.50 $6,934.20 $6,857.70 $540.50 $3.867.90 $3,634.50 $7.943.30 $700.50 $4,080.30 $1.367.80 $6.124.50 $6,082.30 $7.594.30 $931.70 $1,757.00 $655.20 $7.602.40 $1.035.00 $1,395.70 $5.557.90 $2,413.30 $9.994.00 $4.709.90 $1.909.90 $1.266.50 $15.997.00 $1.913.10 $6,834.70 $2,753.60 $6,139.60 $26,254.60 12% $31.155.00 $41.652.00 10% $33.644.00 $39.874.00 1496 $36,932.00 13% $34.159.00 16% $37.849.00 219 $32.570.00 129 $35.729.00 19% $34.947.00 12% $34,381.00 9.2% 7.3% 7.9% 10.0% 8.9% 7.3% 7.7% 7.4% 8.6% 11.0% 7.1% 6.296 $29.580.00 219 $37.902.00 1198 $43.014.00 74 $35.117.00 139 $40,381.00 129 $31.981.00 154 $32.440.00 104 $36,782.00 119 $43,216.00 125 Effectively Communicating Data 247 Bradley Carroll Claibome Grundy Hardeman Henderson Jackson Anderson Campbell 2013 2013 2013 2013 2013 2013 2013 2013 2013 2013 2013 2013 2013 2013 2013 South South South South South South South West West West West West West West West $3,701.70 $18,694.80 $13,000.10 $12,244.90 $29,914.90 $17.090.50 $22,325.20 $1,192.20 $5.262.00 $2.108.10 $10,811.10 $10,444.80 $4,228.70 $8.353.60 $2,486.00 7.6% 7.0% 6.7% 7.9% 5.6% 7.6% 6.3% 9.1% 8.9% 8.9% 6.5% 8.5% 8.5% 7.8% 7.5% $42,725.00 $39,226.00 $41.927.00 $50,240.00 $47.474.00 $38,897.00 $37,061.00 $31.126.00 $45.903.00 $39.948.00 $50,037.00 $34,747.00 $34.320.00 $43.227.00 $29.515.00 12% 12% 10% 4% 5% 12% 16% 17% 5% 8% 5% 14% 16% 10% 17% Cheatam Davidson Gibson Hawkins Johnson Lawrence Apie chart shows the contribution of values to a whole. They are useful w the date is represented in percentages. It is more difficult to use raw data edot Pie charts are not useful in describing data that has negative changes. pe chat and bar graph, particularly when there are disparate differences in med 606 of its revenue from property tax collections, 25% from sales taxes, own for fiscal year 2014 in an exploded three dimensions. As shown, the city from franchise fees, and 696 from business licenses. The consumer can see ata place that the majority of the revenue for the city came from property taxes Le Exhibit 8.5. the revenue collections for the City of Germantown are Effectively Communicating Data 23 Pie Charts 1 P12 P13 PPS collected from badgets sed sales taxes and that franchise fees and business licenses make up a smaller part of the budget in FY 2014. This format is useful when there are several reve- ut categories that are small. e percentage change in property similar graphs are very well bat the amount of the teve Exhibit 8.5 Revenue Collections for the City of Germantown, FY 2014 wn, the change in both the 6% 9% Hections for the City of Property Taxes Sales Taxes |25% A Franchise Fees Business Licenses 160% Property The fees The pie chart in Exhibit 8.6 is a one dimensional exploded pie chart that shows the contributions of each revenue source to the overall budget for Joyner in FY 2014. This format is also useful when there are several revenue con that are small X7 Revenue Collections for the City of Jules, FY 2014 wewe, 239 Efectively Communicating Data 465 13 2015 12% 5% usiness Licenses Sales Taxes Property Taxes Franchise Fees Business Licenses Street Meters Exhibit 8.76 Change in Rev. Collections for the City of Jules, FY 2013-14 10% 9% hat they are not 8% is possible de in Ether. The 6% 5% The carte disadvantar 3% 2% 2% OX -2% Sales Taxes Property Taxes Franchise Fees Business Street Meters Licenses


