

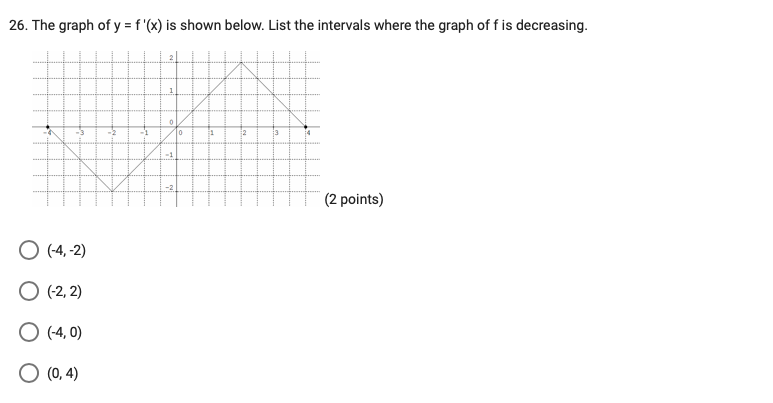
Question: 25. The graph of 1r = f 13:} Is shown below. List the intervals when! the graph of 1' Is decreasing. 27. The function f

![function f is continuous on the interval [2, 10] with some of](https://s3.amazonaws.com/si.experts.images/answers/2024/06/66748bf2b4c54_03466748bf2977fa.jpg)

![The function f ls continuous on the Interval [3, 11] with some](https://s3.amazonaws.com/si.experts.images/answers/2024/06/66748bf475490_03666748bf4580ae.jpg)

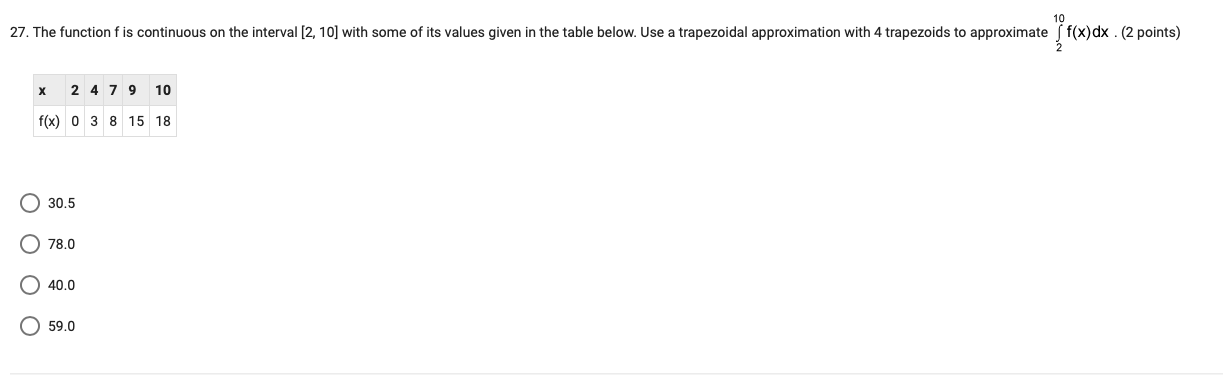
25. The graph of 1r = f 13:} Is shown below. List the intervals when! the graph of 1' Is decreasing. 27. The function f is continuous on the interval [2, 10] with some of its values given in the table below. Use a trapezoidal approximation with 4 trapezoids to approximate f f(x) dx . (2 points) X 2 479 10 f(x) 0 3 8 15 18 30.5 78.0 40.0 59.028. The function f ls continuous on the Interval [3, 11] with some of its values given In the table below. Find the average rate of change in fever the Interval [3, 1 1]. (2 points) K3531D11 f(x) .4 4 1o 16 20 0 None of these 29. If a factory continuously dumps pollutants Into a river at the rate of i tons per day, then the amount dumped after 7 days Is (2 points) 40
Step by Step Solution
There are 3 Steps involved in it

Get step-by-step solutions from verified subject matter experts