

Question: 2:53 Done Tools Window Help 1 7 88% Wed 12:21 807F20 - T-Test vs Regression Bonus Assignment.pdf (page 1 of 2) OPTIONAL BONUS ASSIGNMENT -
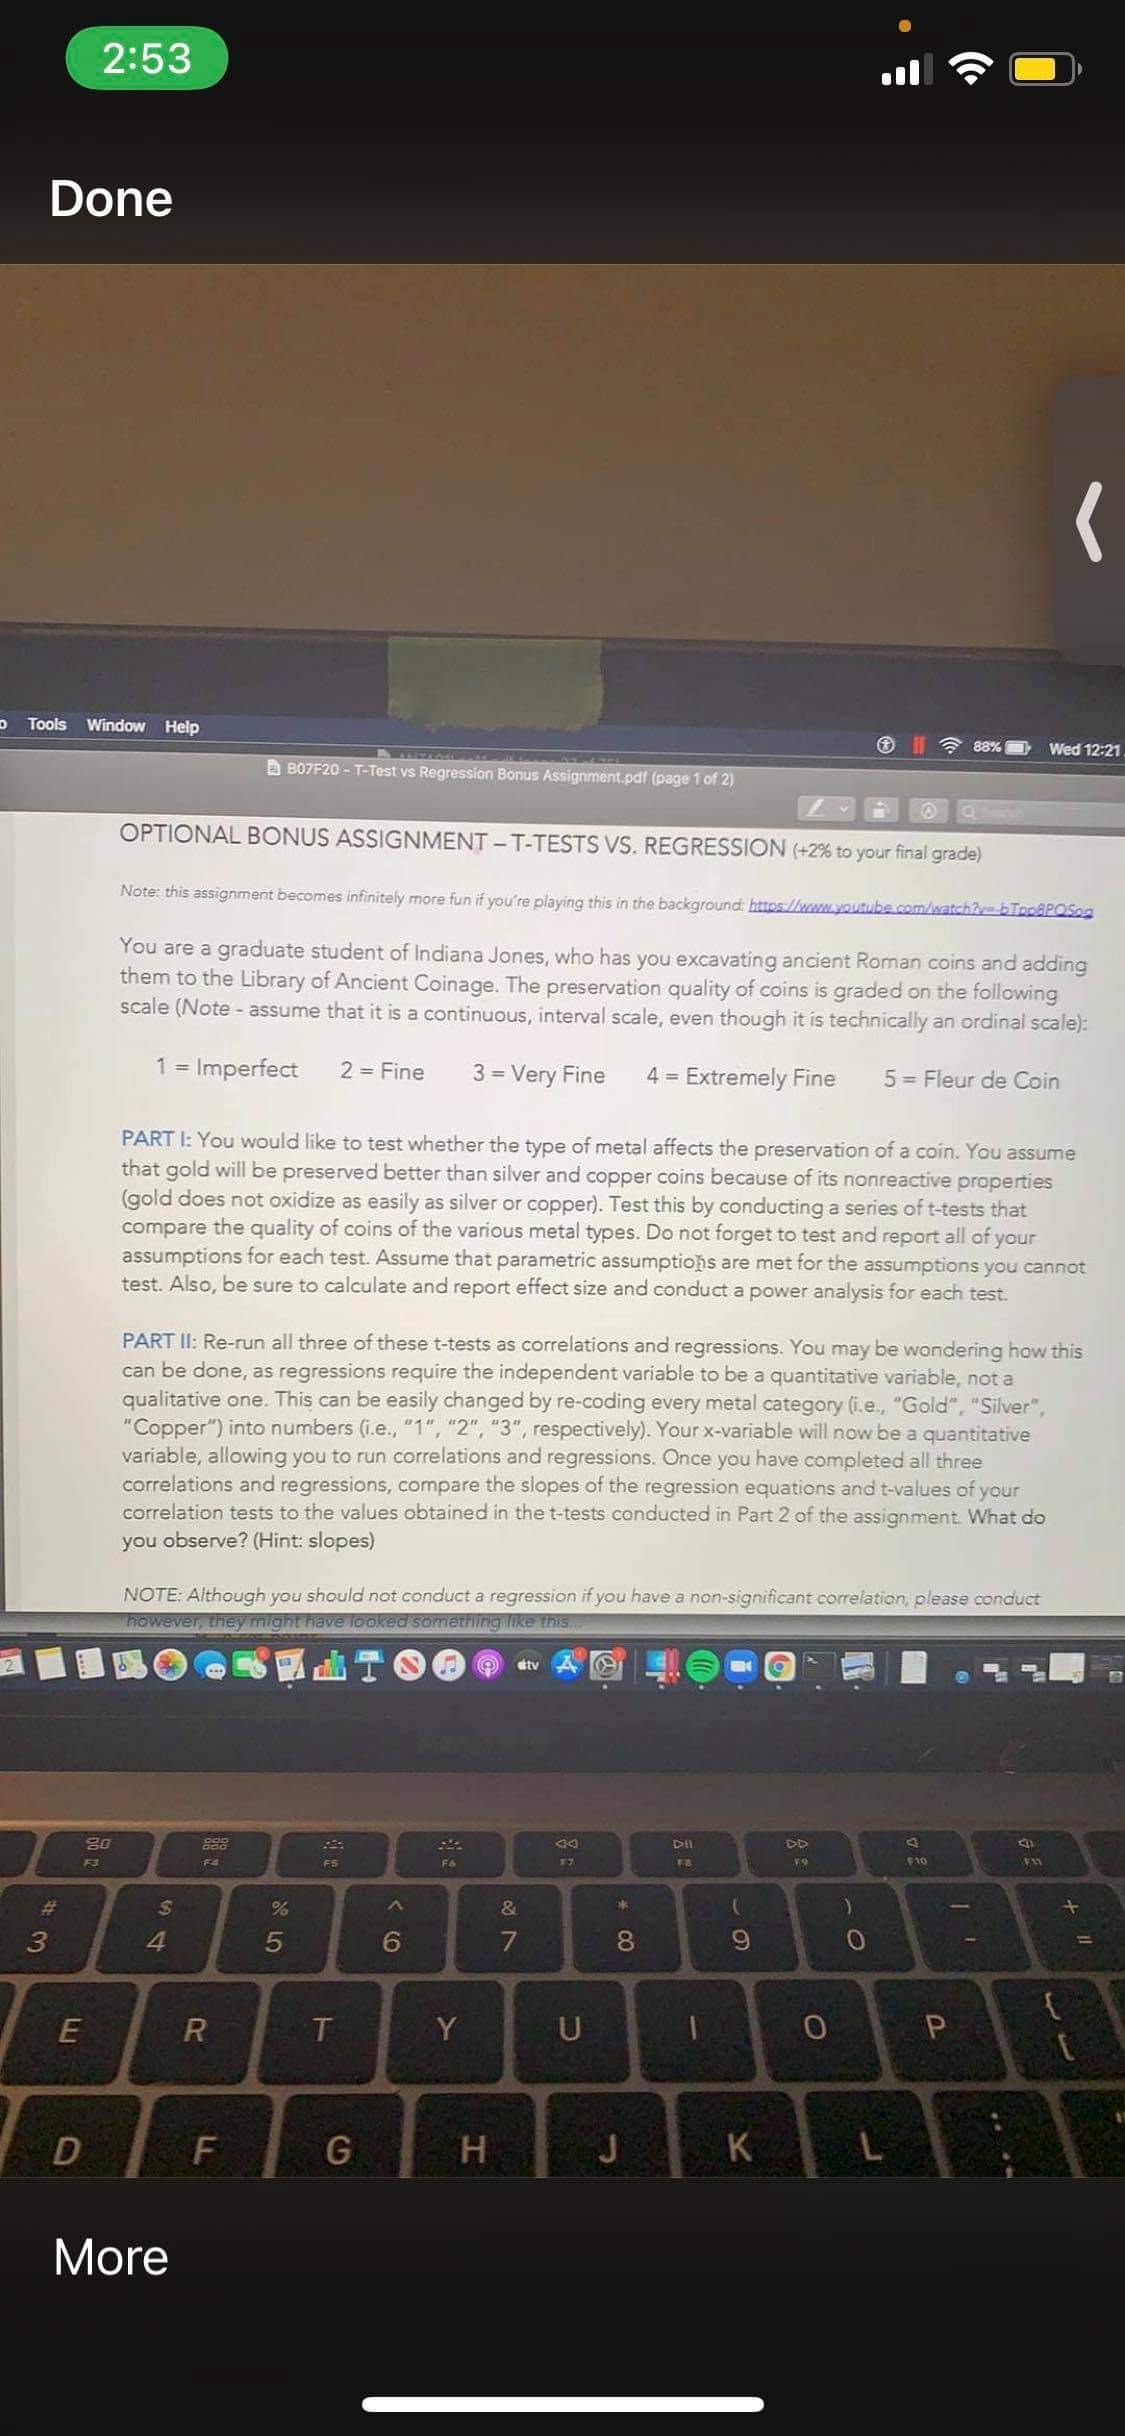
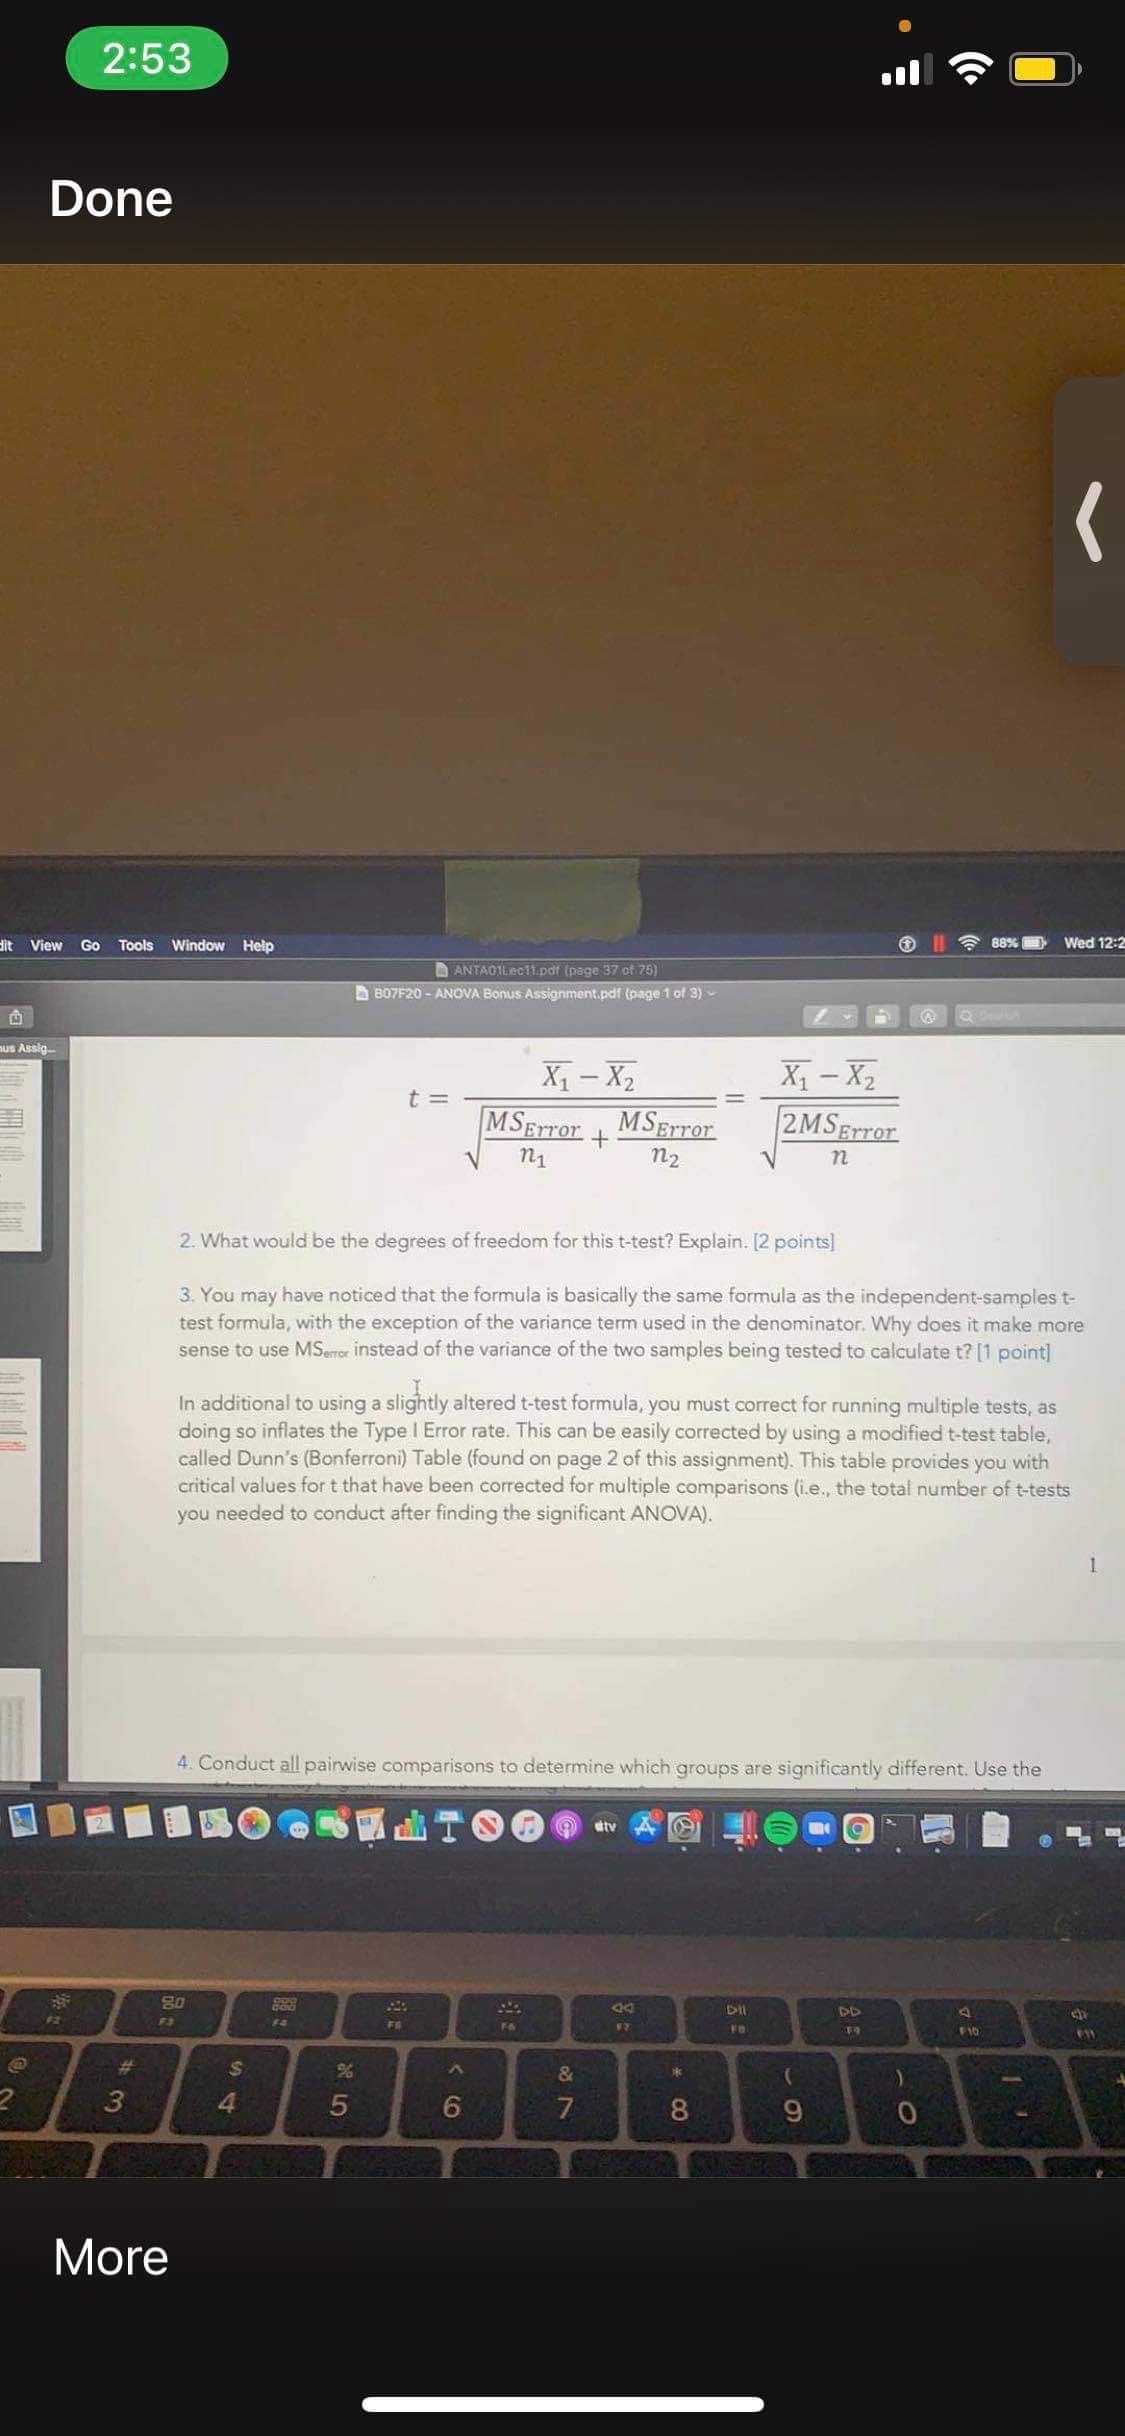
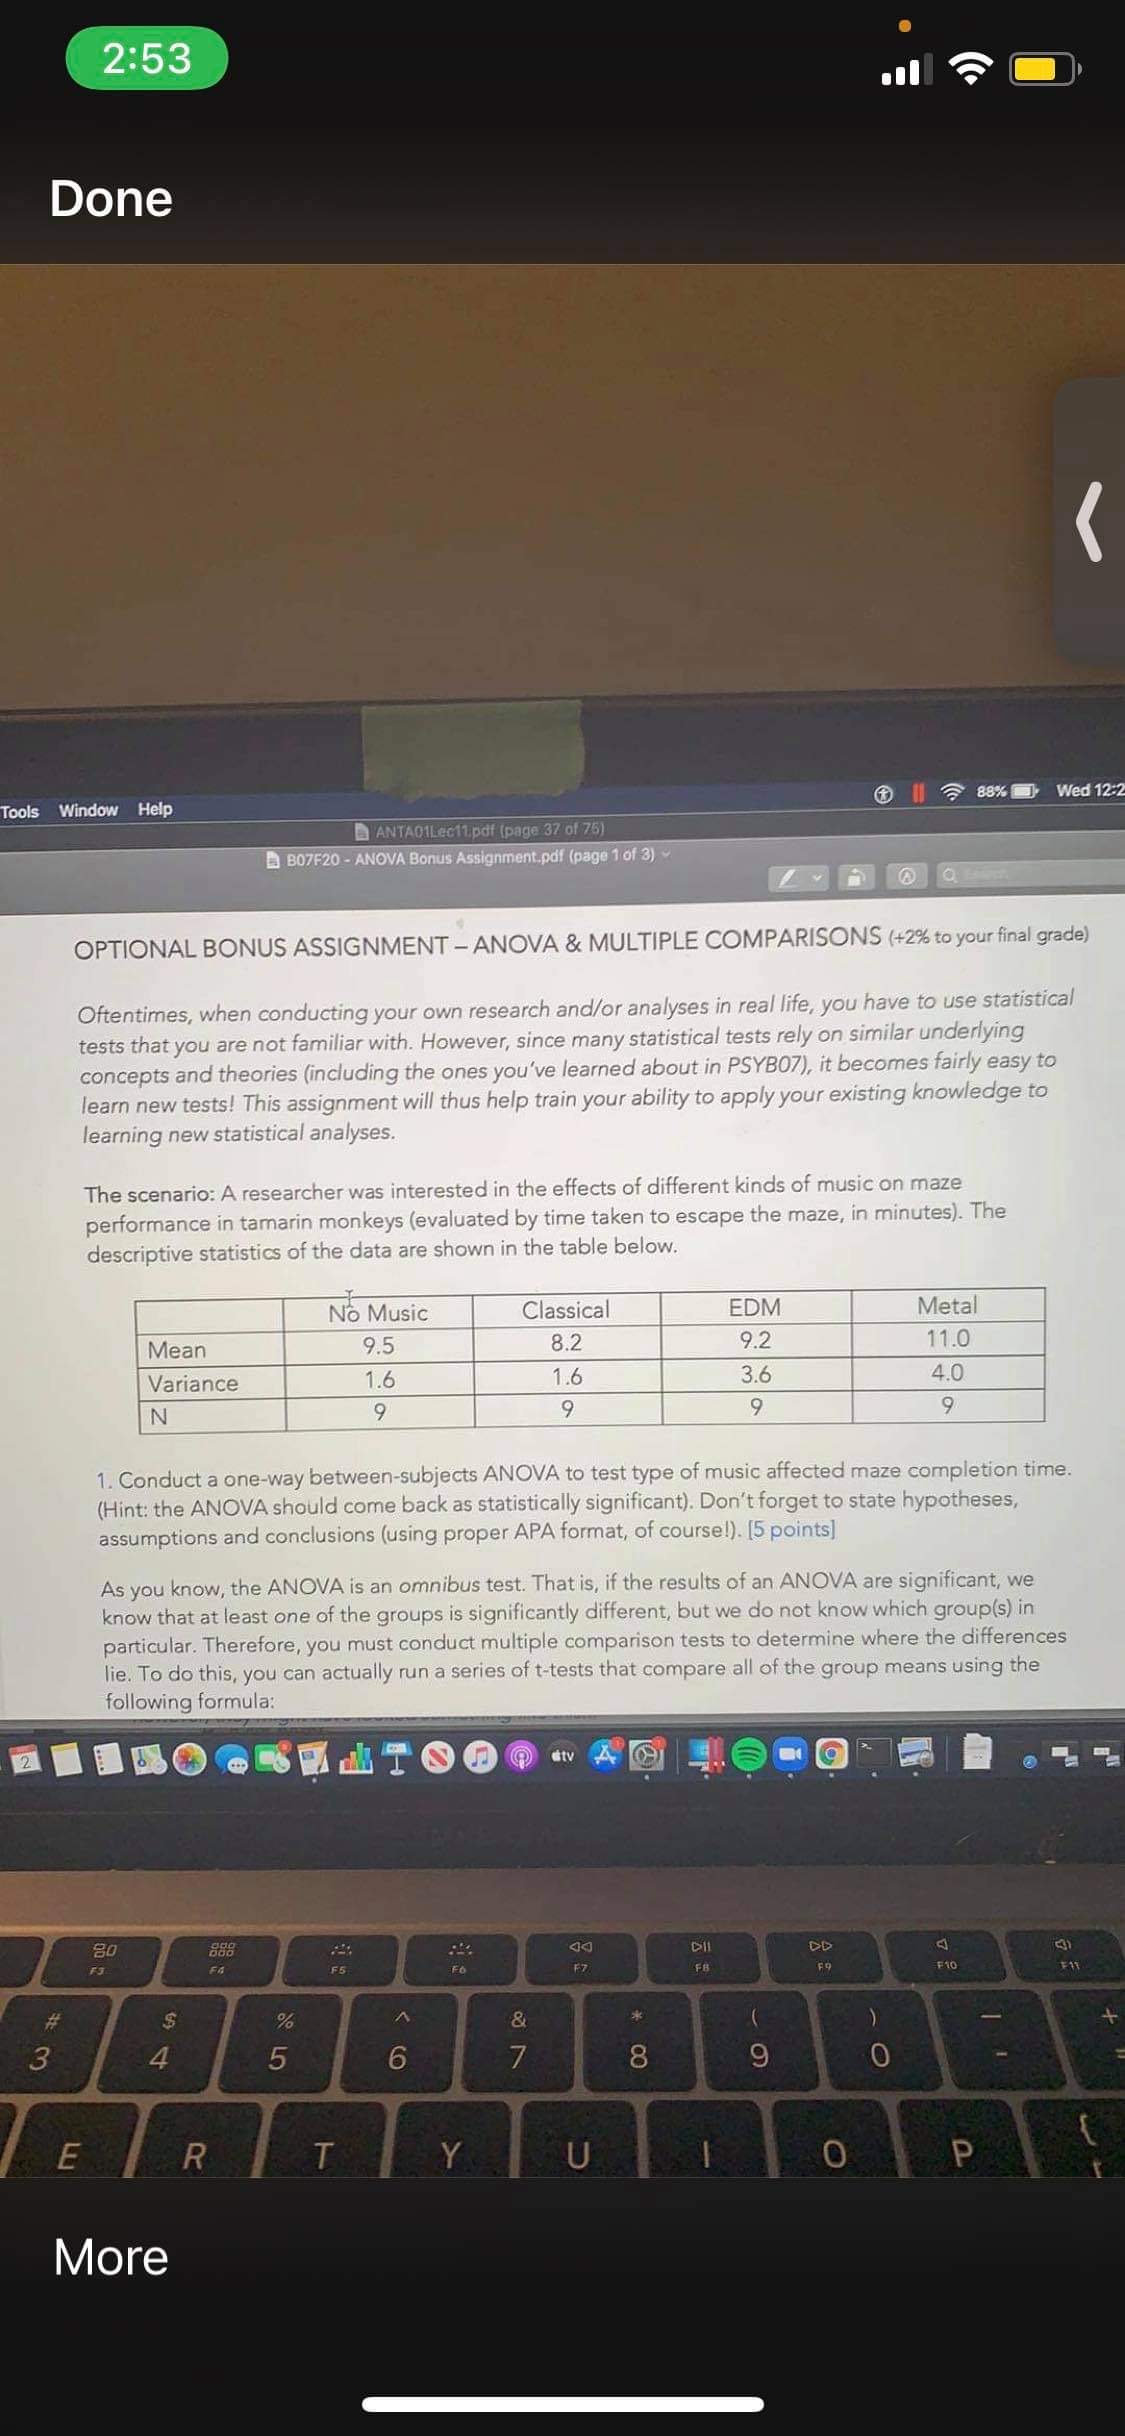
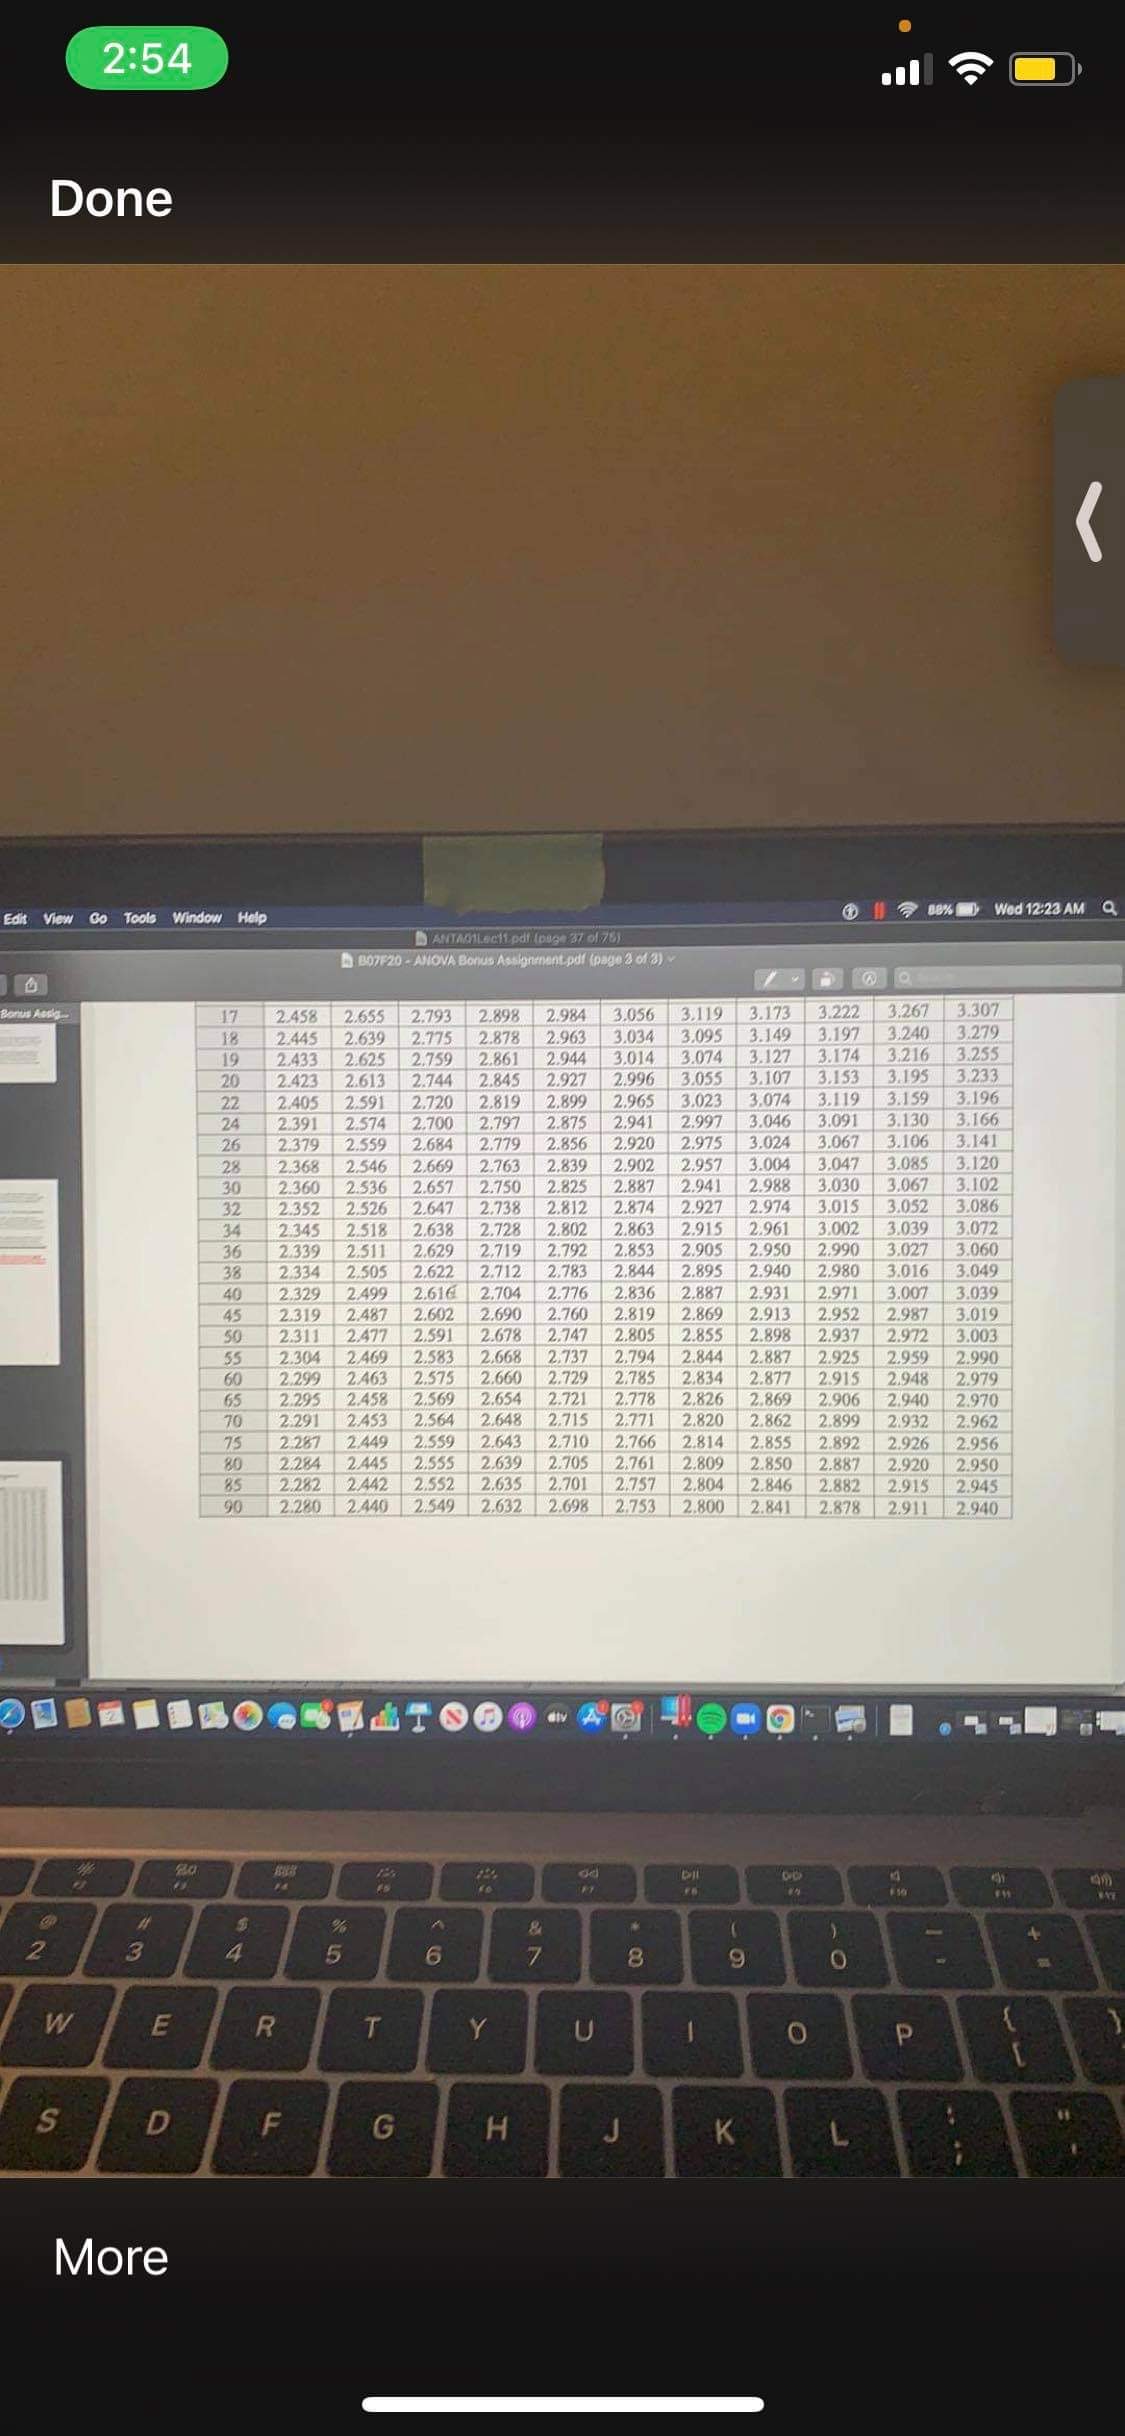


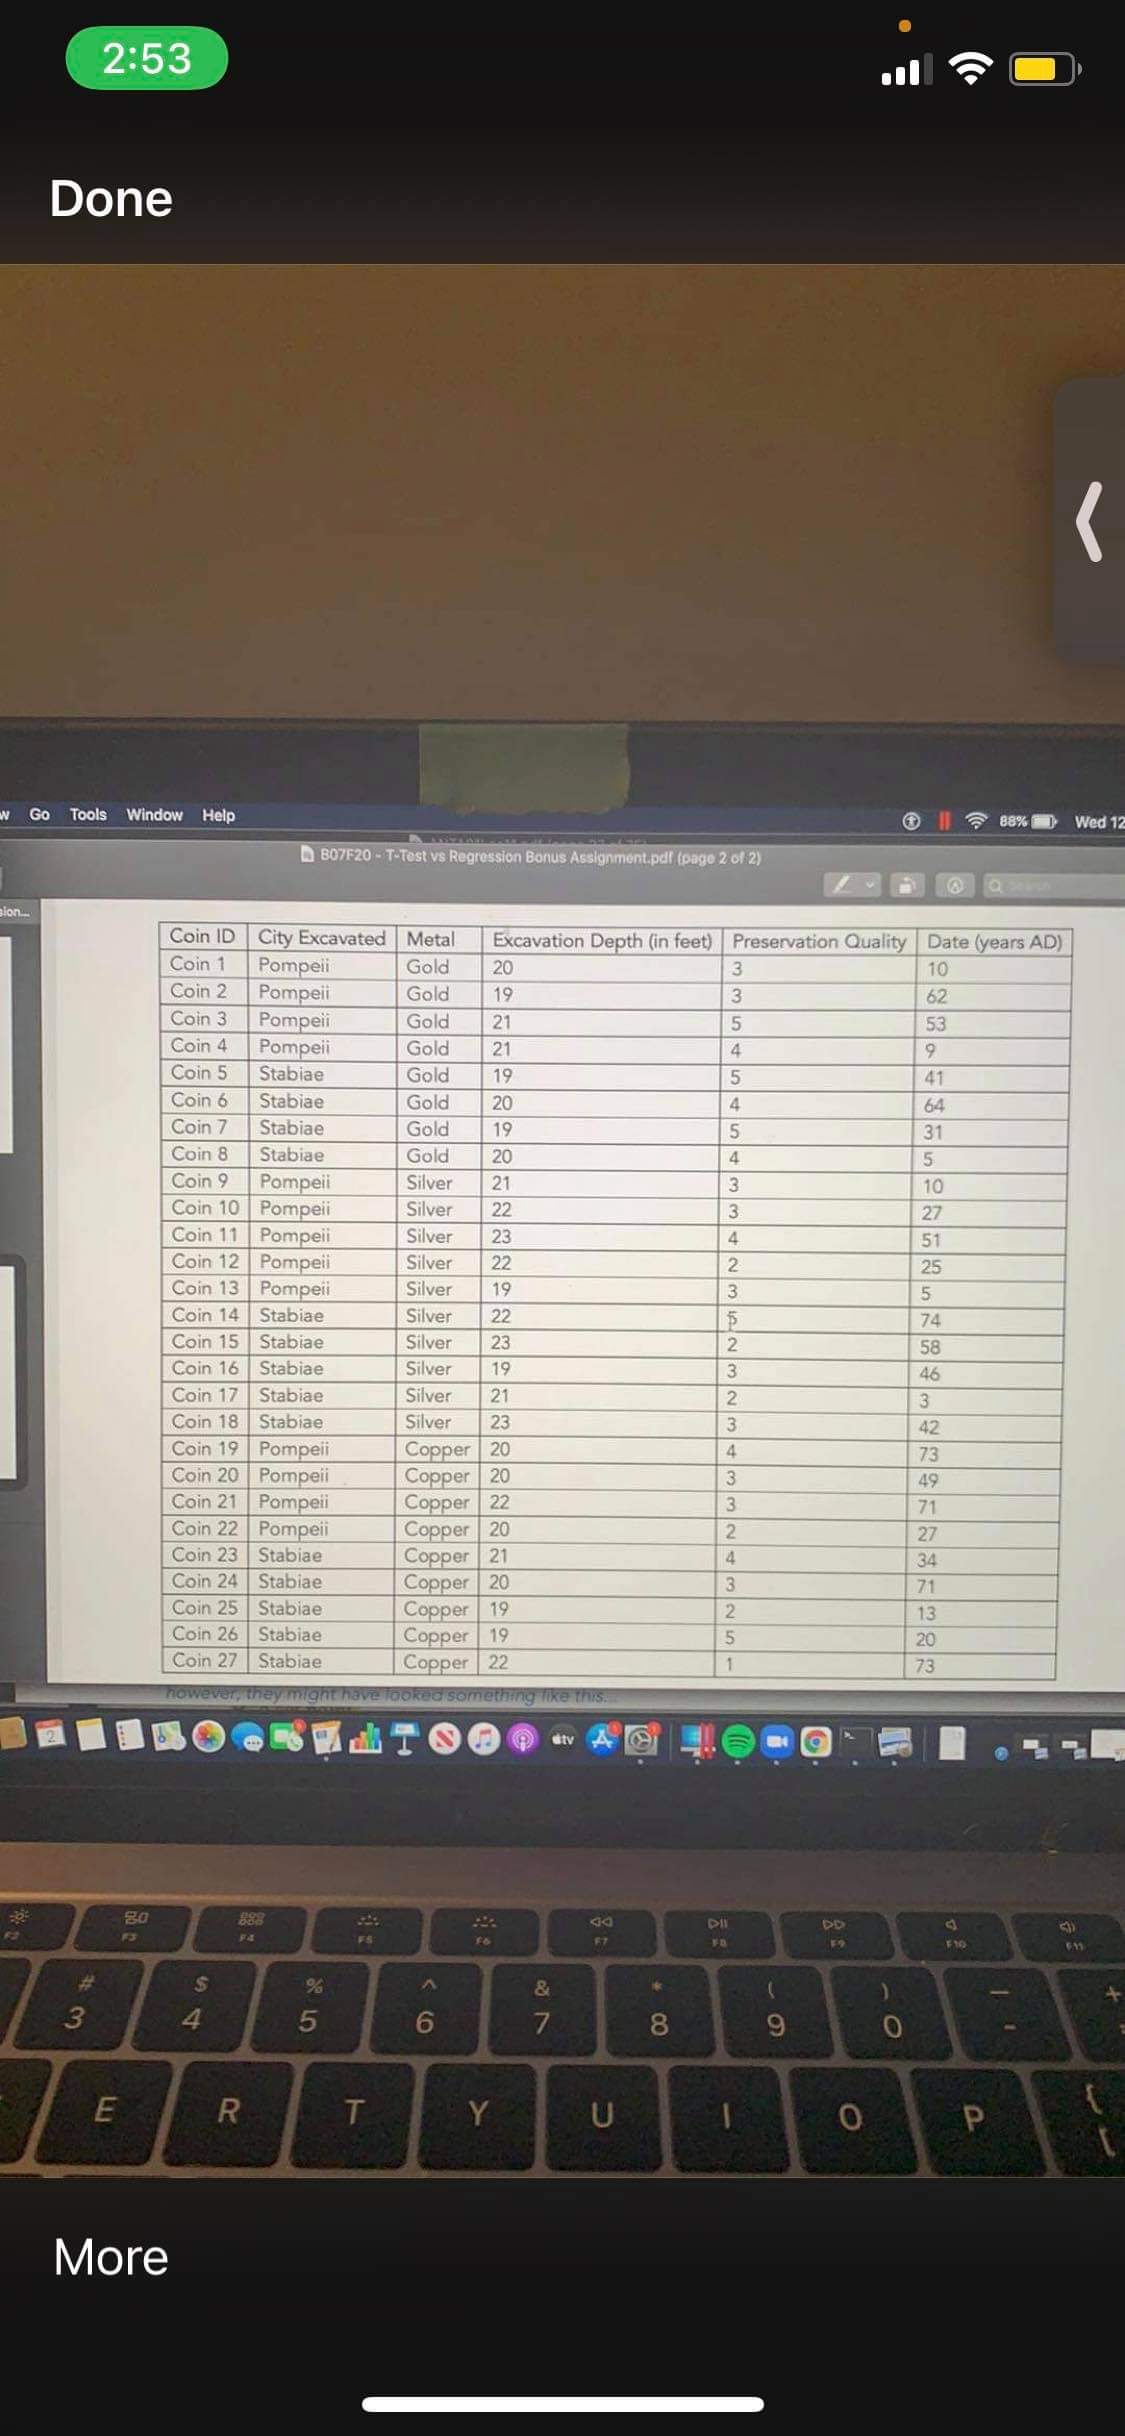
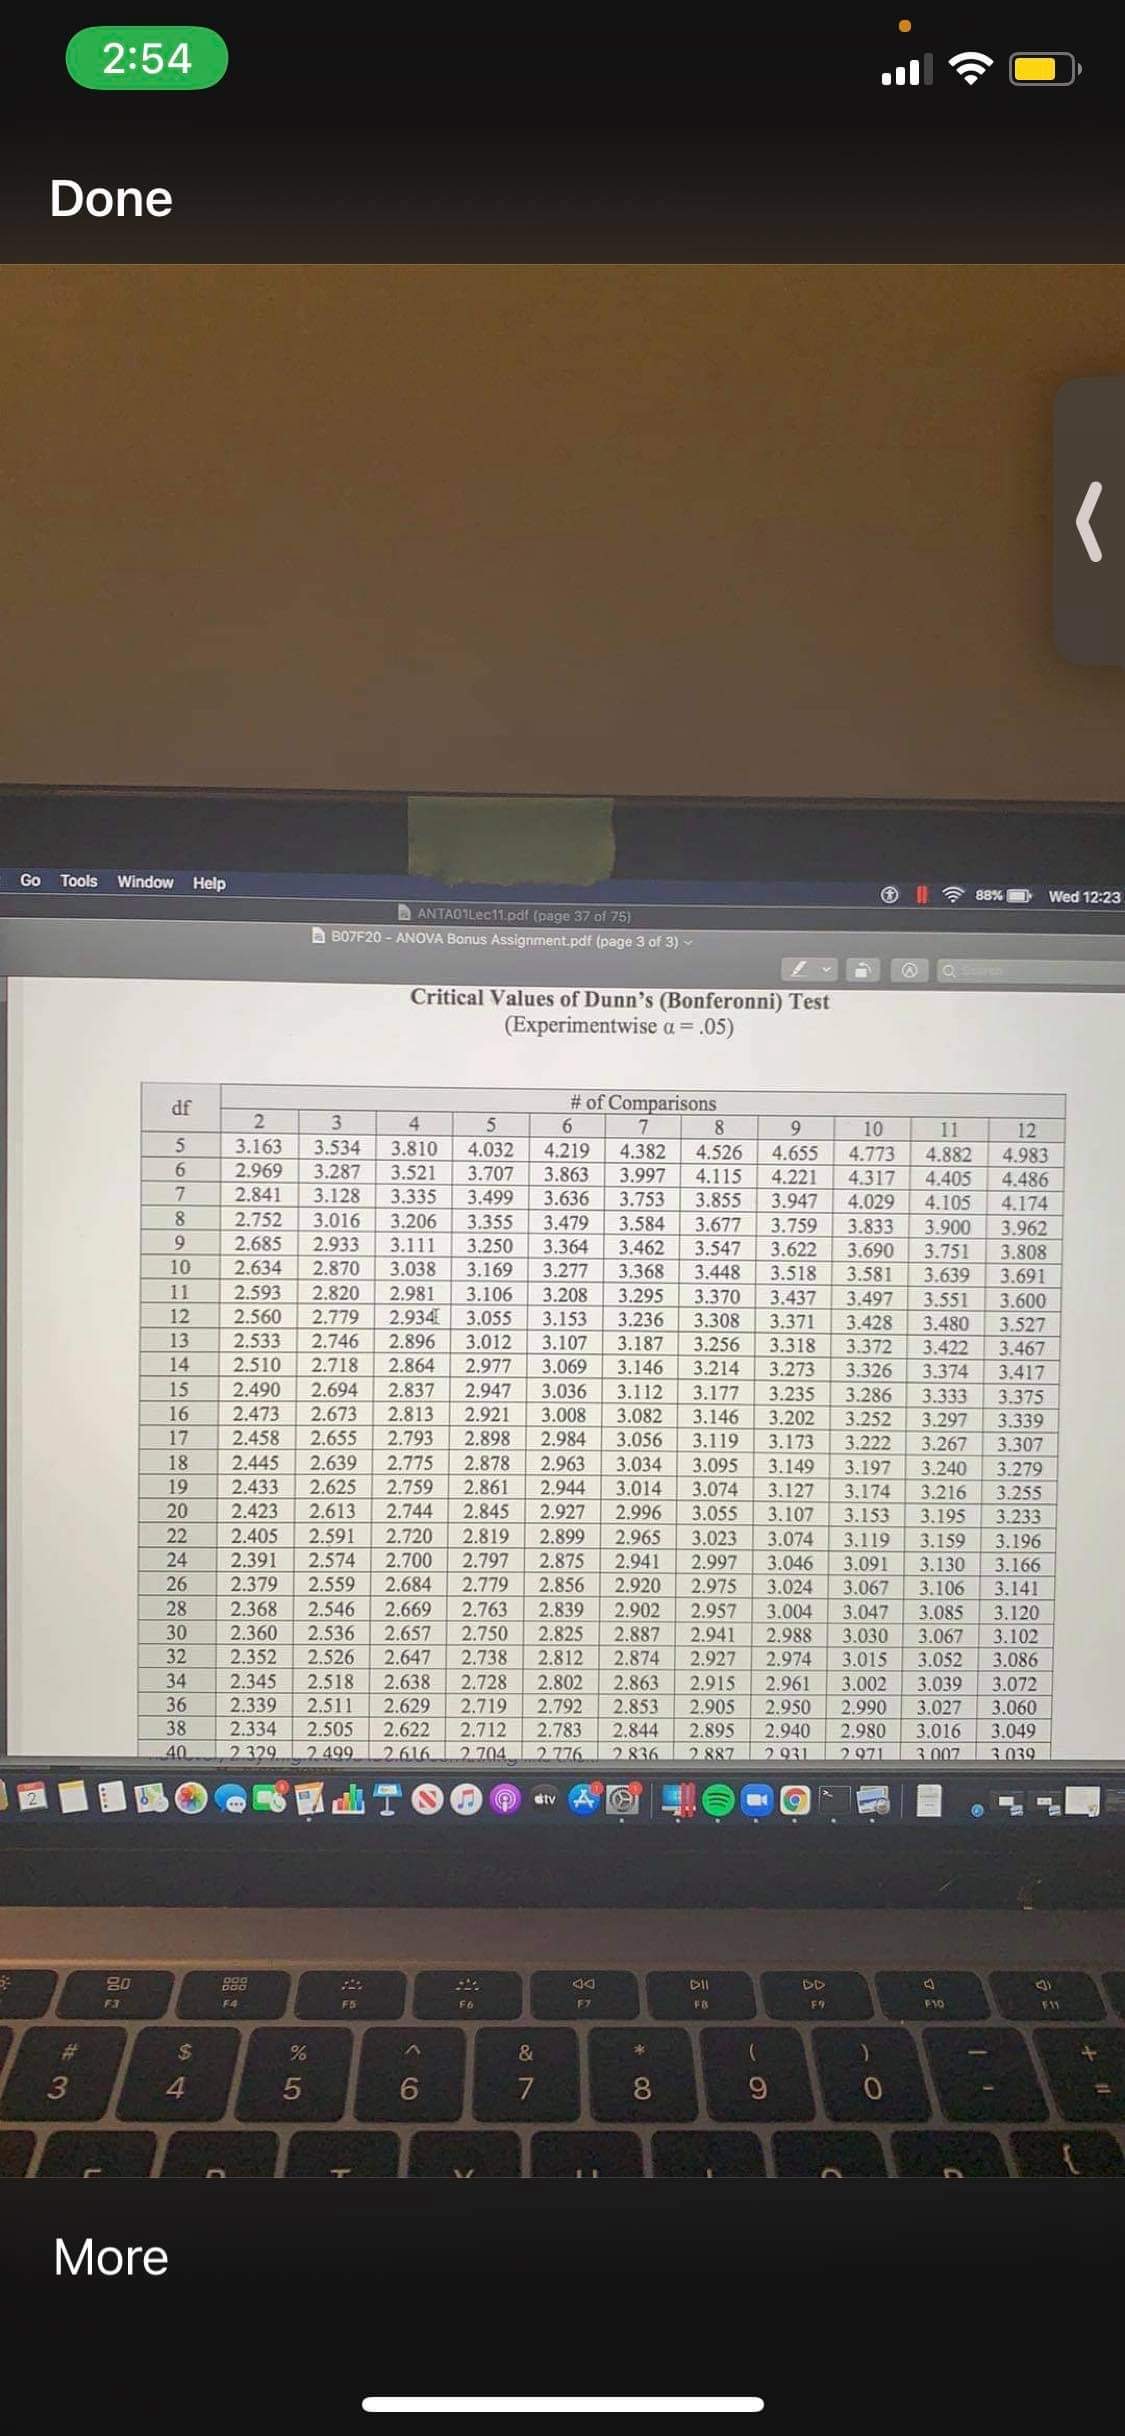
2:53 Done Tools Window Help 1 7 88% Wed 12:21 807F20 - T-Test vs Regression Bonus Assignment.pdf (page 1 of 2) OPTIONAL BONUS ASSIGNMENT - T-TESTS VS. REGRESSION (+2% to your final grade) Note: this assignment becomes infinitely more fun if you're playing this in the background: https://www.youtube.com/watch?=.bToo8PQSog You are a graduate student of Indiana Jones, who has you excavating ancient Roman coins and adding them to the Library of Ancient Coinage. The preservation quality of coins is graded on the following scale (Note - assume that it is a continuous, interval scale, even though it is technically an ordinal scale): 1 = Imperfect 2 = Fine 3 = Very Fine 4 = Extremely Fine 5 = Fleur de Coin PART I: You would like to test whether the type of metal affects the preservation of a coin. You assume that gold will be preserved better than silver and copper coins because of its nonreactive properties (gold does not oxidize as easily as silver or copper). Test this by conducting a series of t-tests that compare the quality of coins of the various metal types. Do not forget to test and report all of your assumptions for each test. Assume that parametric assumptions are met for the assumptions you cannot test. Also, be sure to calculate and report effect size and conduct a power analysis for each test. PART II: Re-run all three of these t-tests as correlations and regressions. You may be wondering how this can be done, as regressions require the independent variable to be a quantitative variable, not a qualitative one. This can be easily changed by re-coding every metal category (i.e., "Gold", "Silver", "Copper") into numbers (i.e., "1", "2", "3", respectively). Your x-variable will now be a quantitative variable, allowing you to run correlations and regressions. Once you have completed all three correlations and regressions, compare the slopes of the regression equations and t-values of your correlation tests to the values obtained in the t-tests conducted in Part 2 of the assignment. What do you observe? (Hint: slopes) NOTE: Although you should not conduct a regression if you have a non-significant correlation, please conduct 2 4 80 DD ES F10 S A 5 6 8 9 O E R T Y U O P D F G H K Moreii Go Tools window Hrp 8mm chiz 3mm - mow 3mm Assignmmtpdl (page I of a) - 27 Whar would be the degrees ol freedom for this Hest? Explain. [2 points[ 3, You may have noticed that the formula is basically the same formula as the independent-samples [- test formula, with the exception efthe variance term USEd in the denominator Why does it make more sense (0 use MS\Tools window Help f,' _ Wed12: B sumo mow Bonus Assignmmndl' laser ial 3) OPTIONAL BONUS ASSIGNMENT ANOVA 8t MULTIPLE COMPARISONS {+25 to your nal grade) Oentimes, when conducting your own research and/or analyses in real life, you have to use statistiwl tests that you are not familiar with. However, since many statistical tests rely on similar underlying concepts and theories (including the ones you 've learned about in PSYBO7), it becomes fairly easy to learn new tests! This assignment will thus help train your ability to apply your existing knowledge to learning new statistical analyses. The scenario: A researcher was interested in the effects of different kinds of music on maze performance in tamarin monkeys (evaluated by time taken to escape the maze. in minutes). The descriptive statistics of the data are shown in the table below. No Music m 9.5 W-l- 1. Conduct a one-way between-subjects ANOVA to test type of music affected maze completion time. (Him: the ANOVA should come back as statistically significant). Don't forget to state hypotheses, assumptions and conclusions (using proper APA format. of coursel). [5 points] Classical As you know, the ANOVA is an omnibus test. Thatis, if the results of an ANOVA are significant,- we know that at least one of the groups is significantly different, but we do not know which groups).-in particular. Therefore, you must conduct multiple comparison tests to determine where\" thedifferences lie. To do this. you can actually run a series of t-tests that compare all of the group means using the following formula: io$$$9wem'g mm- 2:54 Done Edit View Co Tools Window Help 1 7 10% Wed 12:23 AM Q BANTAMLect1. pdf (page 37 of.76) 807F20 - ANOVA Bonus Assignment puf (page 2 of 3) ~ 17 2.458 2.655 2.793 2.898 2.984 3.056 3,119 3.173 3.222 3.267 3.307 18 2.445 2.639 2.775 2.878 2.963 3.034 3.095 3.149 3.197 3.240 3.279 19 2.433 2.625 2.759 2.861 2.944 3.014 3.074 3.127 3.174 3.216 3.255 20 2.423 2.613 2.744 2.845 2.927 2.996 3.055 3.107 3.153 3.195 3.233 22 2.405 2.591 2.720 2.819 2.899 2.965 3.023 3.074 3.119 3.159 3.196 24 2.391 2.574 2.700 2.797 2.875 2.941 2.997 3.046 3.091 3.130 3.166 26 2.379 2.559 2.684 2.779 2.920 2.975 3.024 3.067 3.106 3.141 28 2.368 2.546 2.669 2.763 2,839 2.902 2.957 3.004 3.047 3.085 3.120 30 2.360 2.536 2.657 2.750 2.825 2.887 2.941 2.988 3.030 3.067 3.102 32 2.352 2.526 2.647 2.738 2.812 2.874 2.927 2.974 3.015 3.052 3.086 34 2.345 2.518 2.638 2.728 2.802 2 2.863 2.915 2.961 3.002 3.039 3.072 36 2.339 2.511 2.629 2.719 2.792 2.853 2.905 2.950 2.990 3.027 3.060 38 2.334 2.505 2.622 2.712 2.783 2.844 2.895 2.940 2.980 3.016 3.049 40 2.329 2.499 2.616 2.704 2.776 2.836 2.887 2.931 2.971 3.007 3.039 45 2.319 2.487 2.602 2.690 2.760 2.819 2.869 2.913 2.952 2.987 3 3.019 50 2.311 2.477 2.591 2.678 2,747 2.805 2.855 2.898 2.937 2.972 3.003 55 2.304 2 469 2.583 2,668 2.737 2.794 2.844 2.887 2.925 2.959 2.990 60 2.299 2463 2.575 2.660 2.729 2.785 2.834 2.877 2.915 2.948 2.979 65 2.295 2.458 2.569 2.654 2.721 2.778 2.826 2.869 2.906 2.940 2.970 70 2.291 2453 2.564 2.648 2.715 2.771 2.820 2.862 2.899 2.932 2.962 75 2.287 2.449 2.559 2.643 2.710 2.766 2.814 2.855 2.892 2.926 2.956 80 2.284 2.445 2.555 2.639 2.705 2.761 2.809 2.850 2.887 2.920 2.950 85 2.282 2.442 2.552 2.635 2.701 1 2.757 2.804 2.846 2.882 2.915 2.945 90 2.280 2.440 2.549 2.632 2.698 2.753 2.800 2.841 2.878 2.911 2.940 W S & 4 W E R T U O P S D G H K More2:53 Done jew Tools Window Help 1 2 88% Wed 12:21 ANTAO]Lect1 pat (page 37 of 75) 807F20 - ANOVA Bonus Assignment.pdf (page 2 of 3) ~ 4. Conduct all pairwise comparisons to determine which groups are significantly different. Use the modified t-test formula (shown above) to calculate t for the comparisons, and use the modified t-table to find the critical values for these tests. [6 points] What can you conclude about the experiment? [1 point] Please submit a scan of your handwritten work to Quercus under "Assignments". Do not email your assignment. Submission Instructions: Your full name and student number must be visible on each written page of your calculations, and every page must be numbered. Please include a scan or a photo of your student card with your submission on the first or last page of your handwritten work. Photo submissions are allowed if scans are not possible, but must be compiled into a single Word document first. Please ensure that your pages are uploaded in the correct order. You are expected to hand-white your answers and show all of your steps. Typed answers of any kind will not be accepted for this bonus assignment. Submissions without handwritten calculations will be given an automatic zero. When uploading your handwritten work, please double check that your file is downloadable, and that you have included all of your pages with your submission. You will not be allowed to add missed/forgotten pages after the due date. Please note that students must attempt the entire assignment to get +2% bonus. Partial attempts will not get partial bonus grades, and will automatically receive a zero. Given that the bonus assignment is optional, there will be no extensions granted. Late submissions will not be accepted. The late penalties as outlined in the syllabus do not apply to this assignment. 2 80 888 4 A E R T O More2:53 Done Tools Window Help 1 7 88% Wed 12:22 AM 807F20 - T-Test vs Regression Bonus Assignment.pdf (page 1 of 2) NOTE: Although you should not conduct a regression if you have a non-significant correlation, please conduct ALL THREE REGRESSIONS for the purposes of this assignment, even if any of the correlations are not significant. Please submit a scan of your handwritten work to Quercus under "Assignments". Do not email your assignment. Submission Instructions: Your full name and student number must be visible on each written page of your calculations, and every page must be numbered. Please include a scan or a photo of your student card with your submission on the first or last page of your handwritten work. Photo submissions are allowed if scans are not possible, but must be compiled into a single Word document first. Please ensure that your pages are uploaded in the correct order. You are expected to hand-write your answers and show all of your steps. Typed answers of any kind will not be accepted for this bonus assignment. Submissions without handwritten calculations will be given an automatic zero. When uploading your handwritten work, please double check that your file is downloadable, and that you have included all of your pages with your submission. You will not be allowed to add missed/forgotten pages after the due date. I Please note that students must attempt the entire assignment to get +2% bonus. Partial attempts will not get partial bonus grades, and will automatically receive a zero. Given that the bonus assignment is optional, there will be no extensions granted. Late submissions will not be accepted. The late penalties as outlined in the syllabus do not apply to this assignment. mething like this. DD 80 S 5 8 P E R T Y U O D F G H K More2:53 Done Go Tools Window Help 1788% Wed 1 807F20 - T-Test vs Regression Bonus Assignment.pdf (page 2 of 2) Coin ID City Excavated Metal Excavation Depth (in feet) Preservation Quality |Date (years AD) Coin 1 Pompeii Gold 20 3 10 Coin 2 Pompeii Gold 19 3 62 Coin 3 Pompeii Gold 21 15 53 Coin 4 Pompeii Gold 21 14 9 Coin 5 Stabiae Gold 19 15 41 Coin 6 Stabiae Gold 20 14 64 Coin 7 Stabiae Gold 19 Coin 8 Stabiae Gold 20 Coin 9 Pompeii Silver 21 Coin 10 |Pompeii Silver 22 Coin 11 Pompei Silver 23 Coin 12 Pompei Silver 22 Coin 13 Pompei Silver 19 Coin 14 Stabiae Silver 22 Coin 15 Stabiae Silver 23 Coin 16 Stabiae Silver 19 21 - UIN WAN W W A W N W NOW NAW W AU Coin 17 Stabiae Silver Coin 18 Stabiae Silver 23 Coin 19 |Pompeii Copper 20 Coin 20 Pompeii Copper 20 Coin 21 Pompeii Copper 22 Coin 22 Pompeii Copper |20 Coin 23 |Stabiae Copper 21 Coin 24 Stabiae Copper 20 Coin 25 Stabiae Copper 19 Coin 26 Stabiae Copper |19 20 Coin 27 Stabiae Copper 22 73 21 . 80 688 DD 4 F10 S % & 5 E R T P More2:54 Done Go Tools Window Help 1 7 88% ) Wed 12:23 ANTAO1Lec11.pdf (page 37 of 75) 807F20 - ANOVA Bonus Assignment.pdf (page 3 of 3) Critical Values of Dunn's (Bonferonni) Test (Experimentwise a = .05) df # of Comparisons 2 3 4 5 6 8 9 10 11 12 5 3.163 3.534 3.810 4.032 4.219 4.382 4.526 4.655 4.773 4.882 4.983 6 2.969 3.287 3.521 3.707 3.863 3.997 4.115 4.221 4.317 4.405 4.486 7 2.841 3.128 3.335 3.499 3.636 3.753 3.855 3.947 4.029 4.105 4.174 8 2.752 3.016 3.206 3.355 3.479 3.584 3.677 3.759 3.833 3.900 3.962 2.685 2.933 3.111 3.250 3.364 3.462 3.547 3.622 3.690 3.751 3.808 10 2.634 2.870 3.038 3.169 3.277 3.368 3.448 3.518 3.581 3.639 3.691 11 2.593 2.820 2.981 3.106 3.208 3.295 3.370 3.437 3.497 3.551 3.600 12 2.560 2.779 2.934 3.055 3.153 3.236 3.308 3.371 3.428 3.480 3.527 13 2.533 2.746 2.896 3.012 3.107 3.187 3.256 3.318 3.372 3.422 3.467 14 2.510 2.718 2.864 2.977 3.069 3.146 3.214 3.273 3.326 3.374 3.417 15 2.490 2.694 2.837 2.947 3.036 3.112 3.177 3.235 3.286 3.333 3.375 16 2.473 2.673 2.813 2.921 3.008 3.082 3.146 3.202 3.252 3.297 3.339 17 2.458 2.655 2.793 2.898 2.984 3.056 3.119 3.173 3.222 3.267 3.307 18 2.445 2.639 2.775 2.878 2.963 3.034 3.095 3.149 3.197 3.240 3.279 19 2.433 2.625 2.759 2.861 2.944 3.014 3.074 3.127 3.174 3.216 3.255 20 2.423 2.613 2.744 2.845 2.927 2.996 3.055 3.107 3.153 3.195 3.233 22 2.405 2.591 2.720 2.819 2.899 2.965 3.023 3.074 3.119 3.159 3.196 24 2.391 2.574 2.700 2.797 2.875 2.941 2.997 3.046 3.091 3.130 3.166 26 2.379 2.559 2.684 2.779 2.856 2.920 2.975 3.024 3.067 3.106 3.141 28 2.368 2.546 2.669 2.763 2.839 2.902 2.957 3.004 3.047 3.085 3.120 30 2.360 2.536 2.657 2.750 2.825 2.887 2.941 2.988 3.030 3.067 3.102 32 2.352 2.526 2.647 2.738 2.812 2.874 2.927 2.974 3.015 3.052 3.086 34 2.345 2.518 2.638 2.728 2.802 2 2.863 2.915 2.961 3.002 3.039 3.072 36 2.339 2.511 2.629 2.719 2.792 2.853 2.905 2.950 2.990 3.027 3.060 38 2.334 2.505 2.622 2.712 2.783 2.844 2.895 2.940 2.980 3.016 3.049 40 2329 2499 2616 2704 2776 2836 2887 2931 2971 3007 3039 2 20 SO A FA IS O More
Step by Step Solution
There are 3 Steps involved in it

Get step-by-step solutions from verified subject matter experts