

Question: 26 & 27 please Question 26 (1 point) Jeff was asked to setup a visualization summarizing data on the amount of time it takes for
26 & 27 please 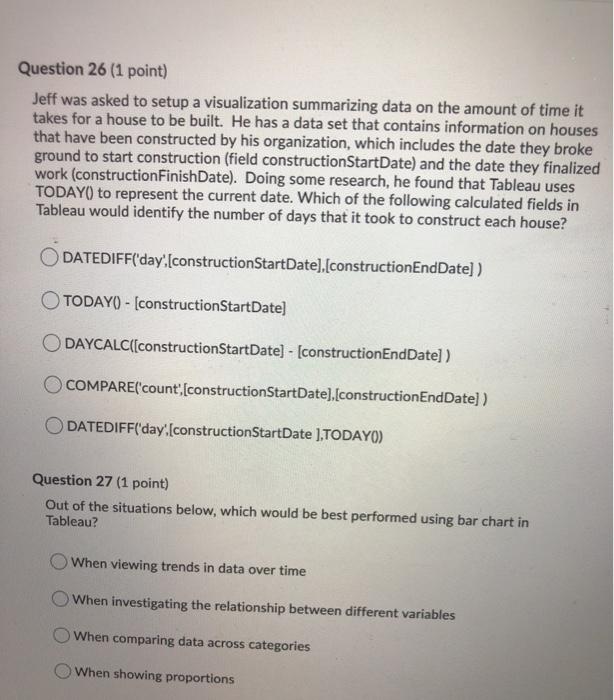
Question 26 (1 point) Jeff was asked to setup a visualization summarizing data on the amount of time it takes for a house to be built. He has a data set that contains information on houses that have been constructed by his organization, which includes the date they broke ground to start construction (field construction StartDate) and the date they finalized work (constructionFinishDate). Doing some research, he found that Tableau uses TODAY() to represent the current date. Which of the following calculated fields in Tableau would identify the number of days that it took to construct each house? DATEDIFF('day,[construction StartDate]. [constructionEndDate] ) TODAY() - [construction StartDate) O DAYCALC([construction StartDate] - [constructionEndDate] ) O COMPARE('count', [construction StartDate).[constructionEndDate]) ODATEDIFF('day'. [construction StartDate ],TODAYO) Question 27 (1 point) Out of the situations below, which would be best performed using bar chart in Tableau? When viewing trends in data over time When investigating the relationship between different variables When comparing data across categories When showing proportions
Step by Step Solution
There are 3 Steps involved in it
1 Expert Approved Answer
Step: 1 Unlock

Question Has Been Solved by an Expert!
Get step-by-step solutions from verified subject matter experts
Step: 2 Unlock
Step: 3 Unlock