

Question: 26. This exercise refers to the drunk driving panel data regression summarized below. Regression Analysis of the Effect of Drunk Driving Laws on Traffic Deaths
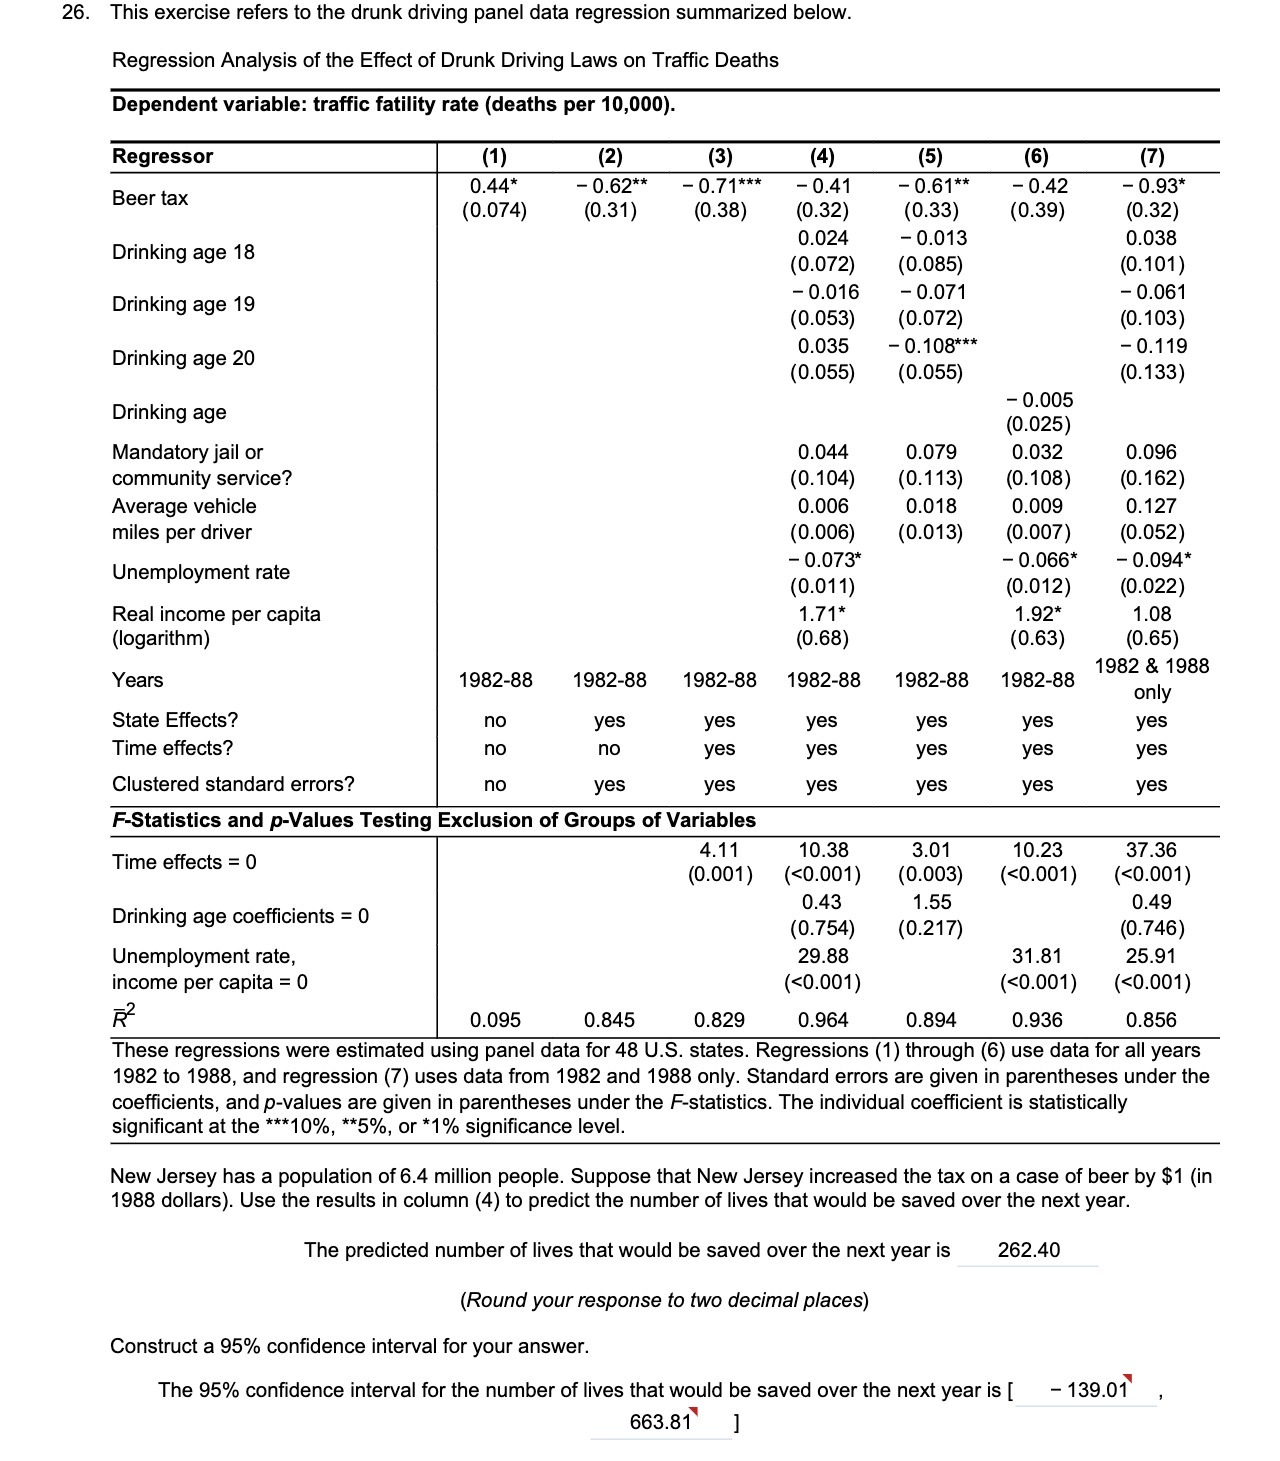
26. This exercise refers to the drunk driving panel data regression summarized below. Regression Analysis of the Effect of Drunk Driving Laws on Traffic Deaths Dependent variable: traffic fatility rate (deaths per 10,000). Regressor (1) (2) (3) (4) (5) (6) (7) 0.44* - 0.62** - 0.71** * - 0.41 - 0.61** - 0.42 - 0.93* Beer tax (0.074) (0.31) (0.38) 0.32) 0.33) 0.39) (0.32) 0.024 - 0.013 0.038 Drinking age 18 (0.072) (0.085) 0.101) - 0.016 - 0.071 - 0.061 Drinking age 19 (0.053) (0.072) 0.103) 0.035 - 0.108*** - 0.119 Drinking age 20 (0.055) (0.055) (0.133) - 0.005 Drinking age (0.025) Mandatory jail or 0.044 0.079 0.032 0.096 community service? (0.104) (0.113) (0.108 0.162) Average vehicle 0.006 0.018 0.009 0.127 miles per driver (900 0) (0.013) (0.007 (0.052) - 0.073* - 0.066* - 0.094* Unemployment rate (0.011) (0.012 (0.022) Real income per capita 1.71* 1.92* 1.08 (logarithm) (0.68) (0.63 (0.65) 1982 & 1988 Years 1982-88 1982-88 1982-88 1982-88 1982-88 1982-88 only State Effects? no yes yes yes yes yes yes Time effects? 10 no yes yes yes yes yes Clustered standard errors? yes yes yes yes yes yes F-Statistics and p-Values Testing Exclusion of Groups of Variables 10.38 3.01 10.23 37.3 Time effects = 0 4.11 (0.001) (
Step by Step Solution
There are 3 Steps involved in it

Get step-by-step solutions from verified subject matter experts