

Question: Question 7 This exercise refers to the drunk driving panel data regression, summarised in Table 10.1 on pages 31 and 32 of the Lecture 8

Question 7
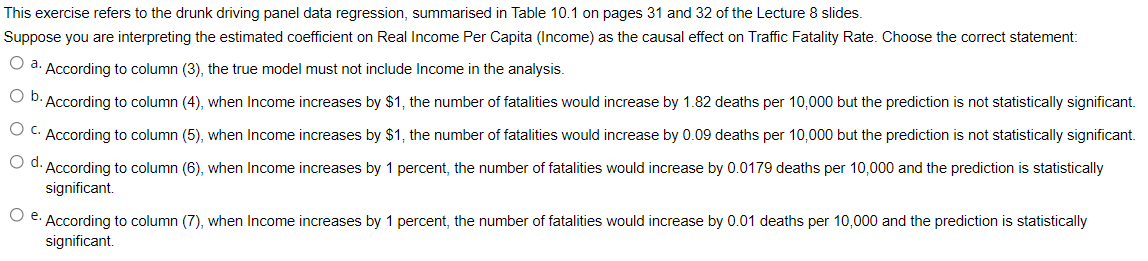
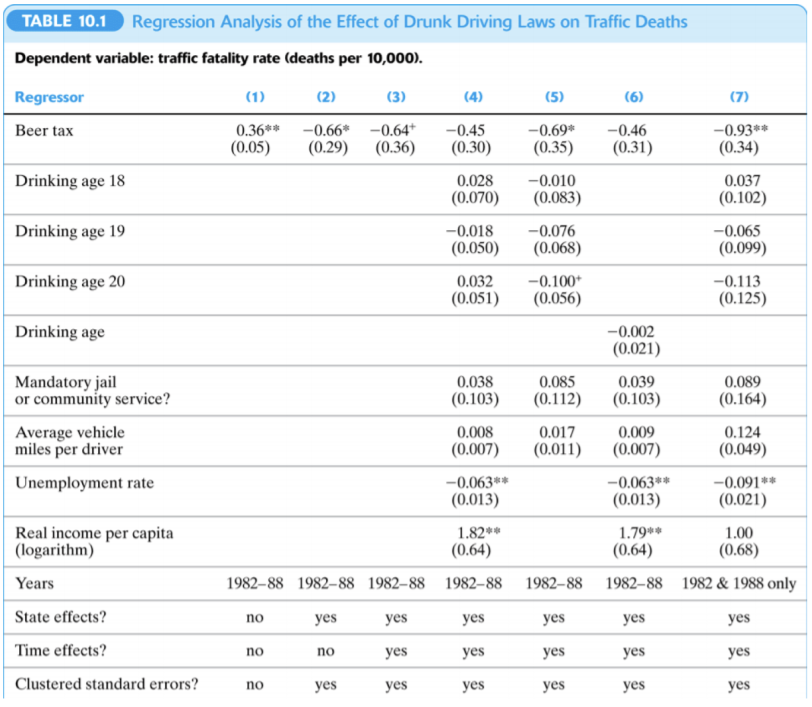
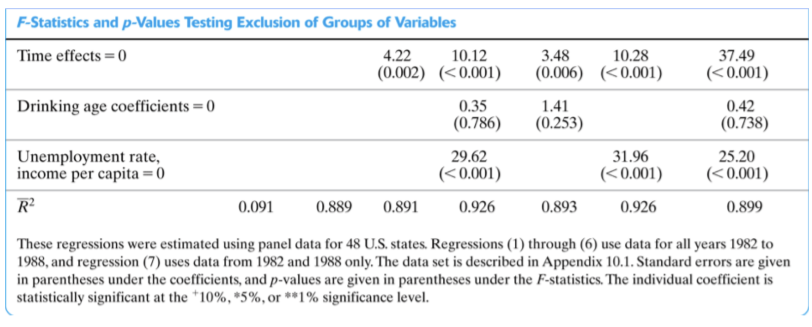
This exercise refers to the drunk driving panel data regression, summarised in Table 10.1 on pages 31 and 32 of the Lecture 8 slides. Suppose you are interpreting the estimated coefficient on Real Income Per Capita (Income) as the causal effect on Traffic Fatality Rate. Choose the correct statement: O a. According to column (3), the true model must not include Income in the analysis. b. According to column (4), when Income increases by $1, the number of fatalities would increase by 1.82 deaths per 10,000 but the prediction is not statistically significant. C. According to column (5), when Income increases by $1, the number of fatalities would increase by 0.09 deaths per 10,000 but the prediction is not statistically significant. d.According to column (6), when Income increases by 1 percent, the number of fatalities would increase by 0.0179 deaths per 10,000 and the prediction is statistically significant. . According to column (7), when Income increases by 1 percent, the number of fatalities would increase by 0.01 deaths per 10,000 and the prediction is statistically significant.TABLE 10.1 Regression Analysis of the Effect of Drunk Driving Laws on Traffic Deaths Dependent variable: traffic fatality rate (deaths per 10,000). Regressor (1) (2) (3) (4) (5) (6) (7) Beer tax 0.36** -0.66* -0.64+ -0.45 -0.69* -0.46 -0.93** (0.05) (0.29) (0.36) (0.30) (0.35) (0.31) (0.34) Drinking age 18 0.028 -0.010 0.037 (0.070) (0.083) (0.102) Drinking age 19 -0.018 -0.076 -0.065 (0.050) (0.068) (0.099) Drinking age 20 0.032 -0.100+ -0.113 (0.051) (0.056) (0.125) Drinking age -0.002 (0.021) Mandatory jail 0.038 0.085 0.039 0.089 or community service? (0.103) (0.112) (0.103) (0.164) Average vehicle 0.008 0.017 0.009 0.124 miles per driver (0.007) (0.011) (0.007) (0.049) Unemployment rate -0.063** -0.063** -0.091** (0.013) (0.013) (0.021) Real income per capita 1.82** 1.79 1.00 (logarithm) (0.64) (0.64) (0.68) Years 1982-88 1982-88 1982-88 1982-88 1982-88 1982-88 1982 & 1988 only State effects? no yes yes yes yes yes yes Time effects? no no yes yes yes yes yes Clustered standard errors? no yes yes yes yes yes yesF-Statistics and p-Values Testing Exclusion of Groups of Variables Time effects = 0 4.22 10.12 3.48 10.28 37.49 (0.002) (
Step by Step Solution
There are 3 Steps involved in it

Get step-by-step solutions from verified subject matter experts