

Question: 26.A quality control chart for variables that indicates when changes occur in the central tendency of a production process: A R-chart B. P-chart C. X-chart
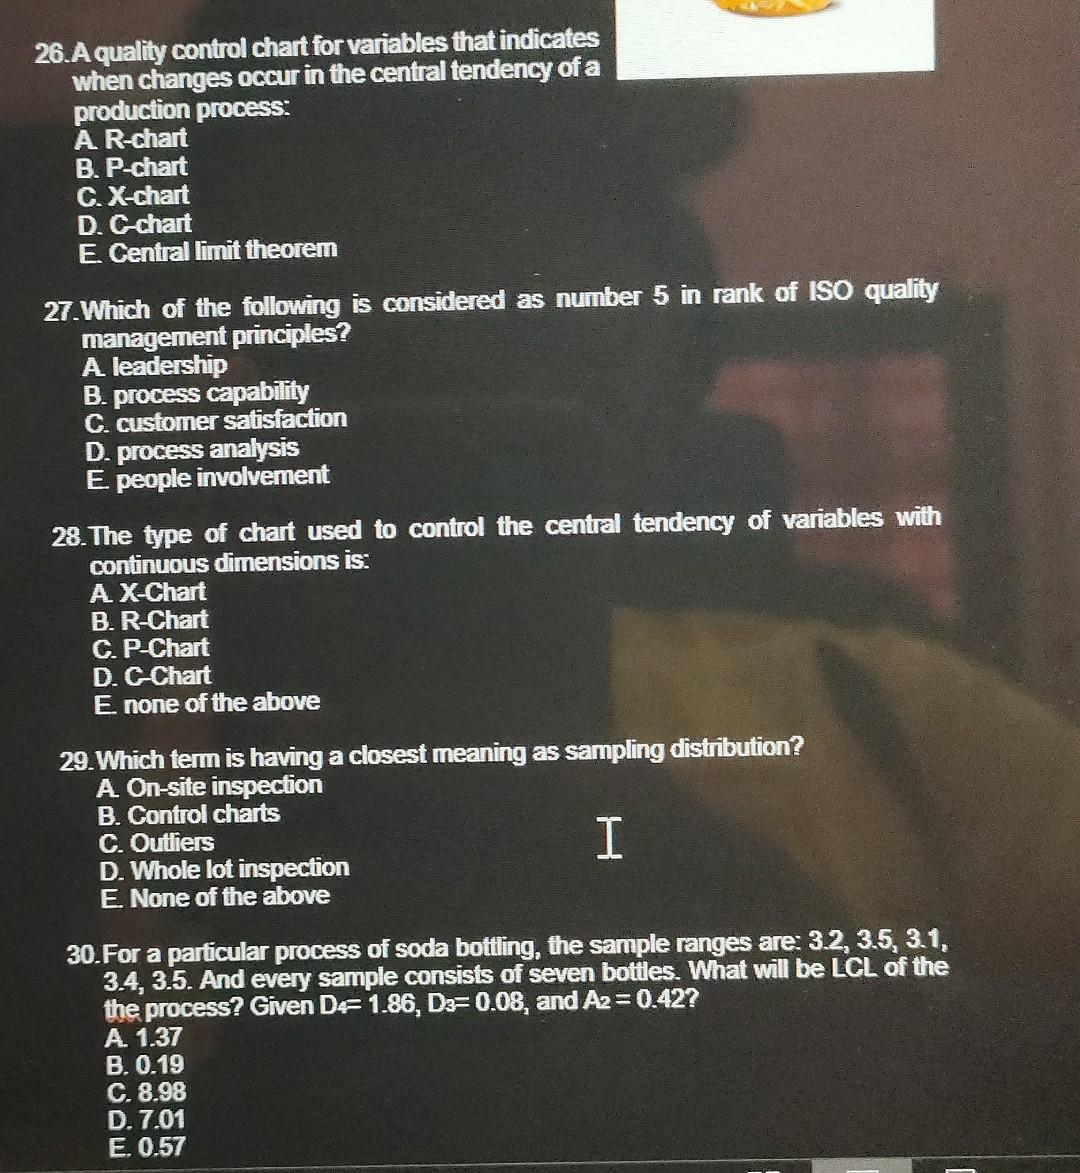
26.A quality control chart for variables that indicates when changes occur in the central tendency of a production process: A R-chart B. P-chart C. X-chart D. C chart E Central limit theorem 27. Which of the following is considered as number 5 in rank of ISO quality management principles? A leadership B. process capability C. customer satisfaction D. process analysis E people involvement 28. The type of chart used to control the central tendency of variables with continuous dimensions is: A X-Chart B. R-Chart C. P-Chart D. C-Chart E none of the above 29. Which term is having a closest meaning as sampling distribution? A On-site inspection B. Control charts C. Outliers D. Whole lot inspection E. None of the above I 30.For a particular process of soda bottling, the sample ranges are: 3.2, 3.5, 3.1, 3.4, 3.5. And every sample consists of seven bottles. What will be LCL of the the process? Given De 1.86, Dz=0.08, and A2 = 0.42? A 1.37 B. 0.19 C. 8.98 D. 7.01 E. 0.57
Step by Step Solution
There are 3 Steps involved in it
1 Expert Approved Answer
Step: 1 Unlock

Question Has Been Solved by an Expert!
Get step-by-step solutions from verified subject matter experts
Step: 2 Unlock
Step: 3 Unlock