

Question: 27. Consider the car ride represented by the graph shown at right. 50. 40 Distance, 30 in miles 20- 10 10 20 30 40 50
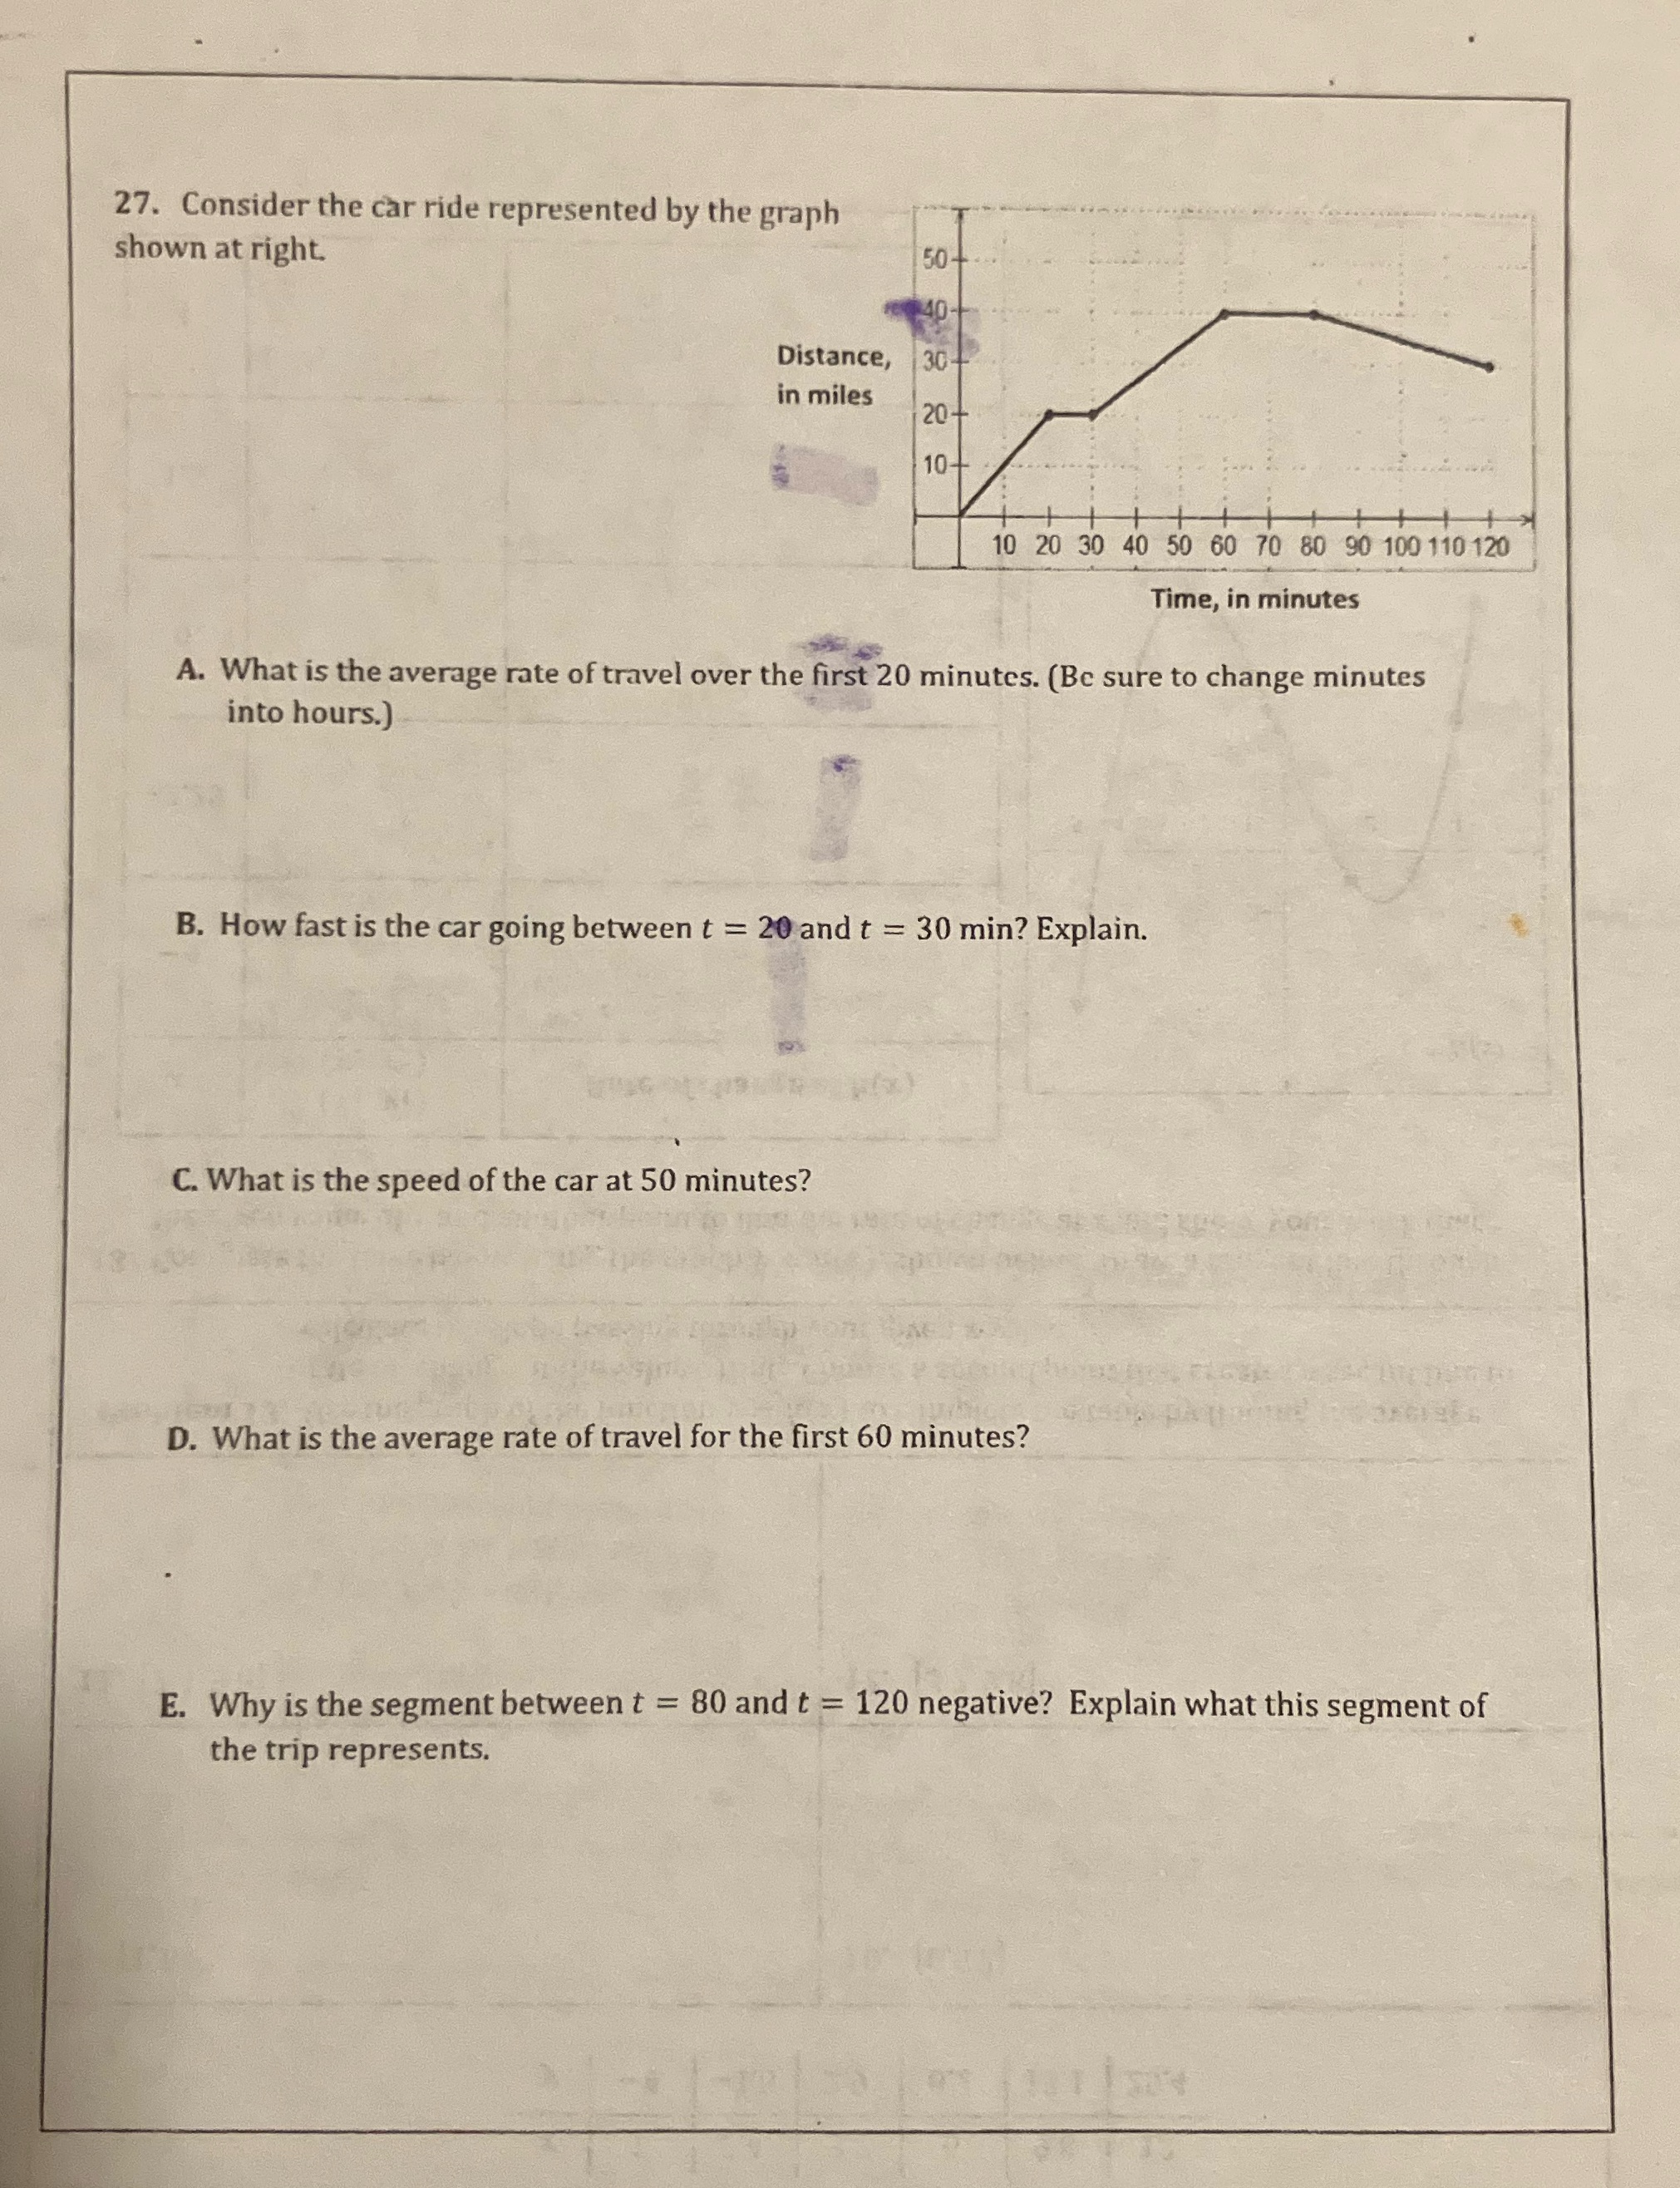
27. Consider the car ride represented by the graph shown at right. 50. 40 Distance, 30 in miles 20- 10 10 20 30 40 50 60 70 80 90 100 110 120 Time, in minutes A. What is the average rate of travel over the first 20 minutes. (Be sure to change minutes into hours.) B. How fast is the car going between t = 20 and t = 30 min? Explain. C. What is the speed of the car at 50 minutes? D. What is the average rate of travel for the first 60 minutes? E. Why is the segment between t = 80 and t = 120 negative? Explain what this segment of the trip represents
Step by Step Solution
There are 3 Steps involved in it
1 Expert Approved Answer
Step: 1 Unlock

Question Has Been Solved by an Expert!
Get step-by-step solutions from verified subject matter experts
Step: 2 Unlock
Step: 3 Unlock