

Question: 2.7 HW X + es/24606/assignments/509305 Megan is an industrial engineer for Coyner Cola Company. She takes a random sample of cola cans from the
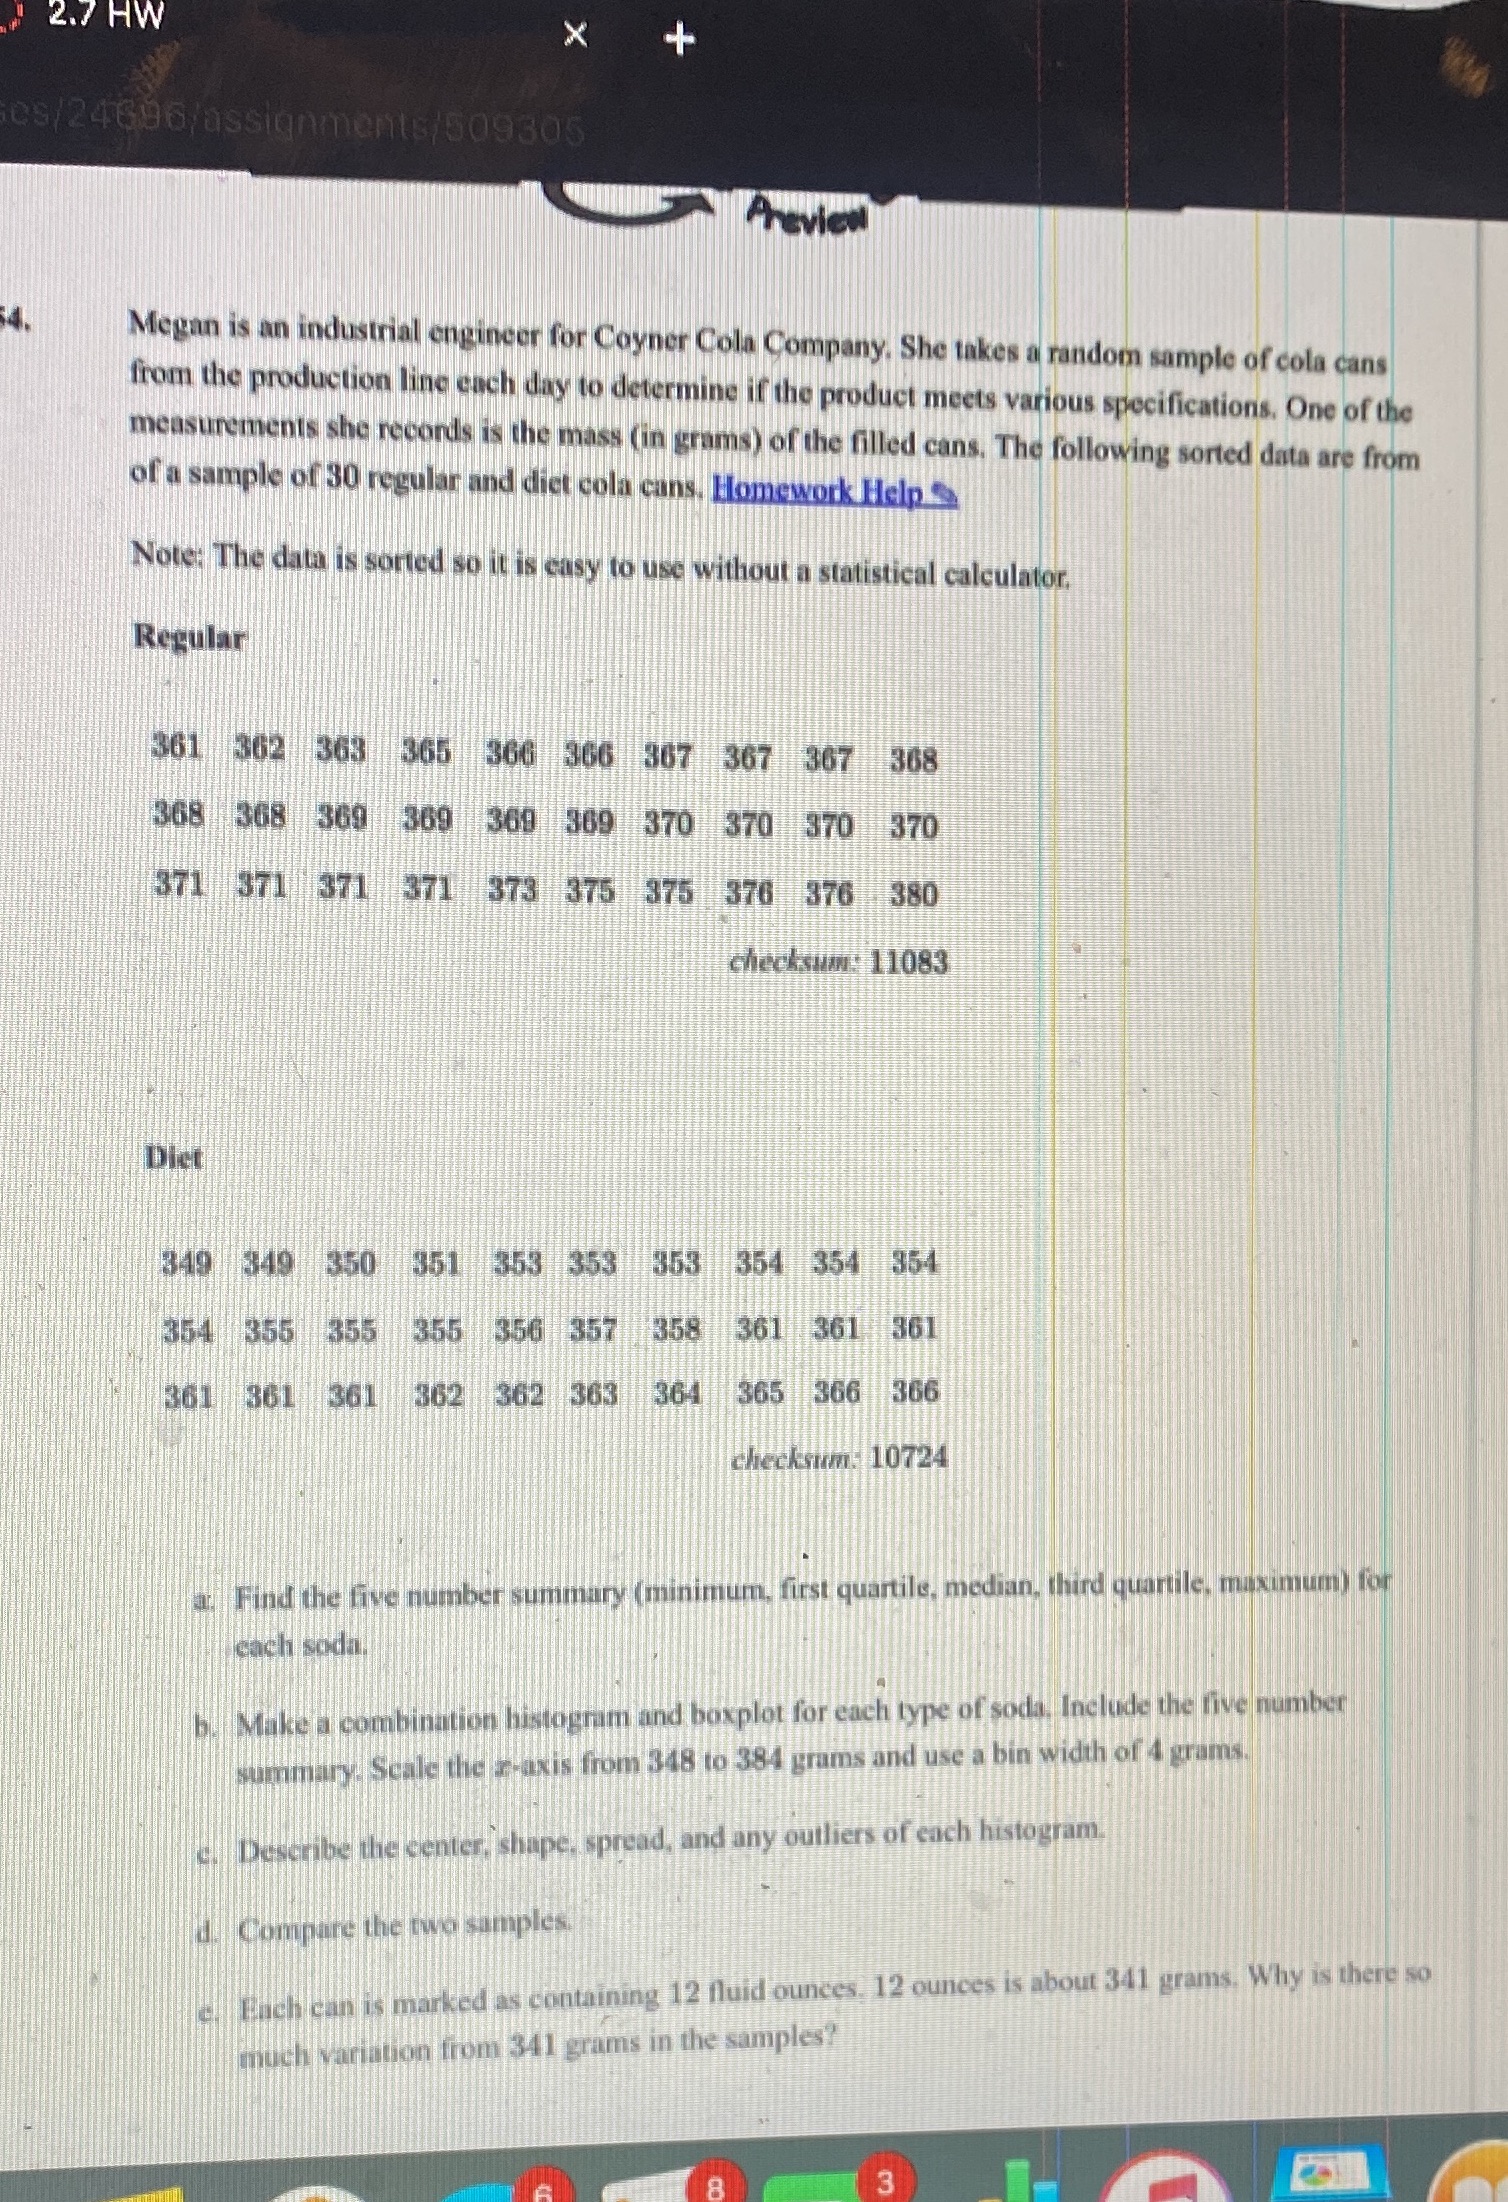
" 2.7 HW X + es/24606/assignments/509305 Megan is an industrial engineer for Coyner Cola Company. She takes a random sample of cola cans from the production line each day to determine if the product meets various specifications, One of the measurements she records is the mass (in grams) of the filled cans. The following sorted data are from of a sample of 30 regular and diet cola cans. Homework Help Note: The data is sorted so it is easy to use without a statistical calculator. Regular 361 362 363 365 366 366 367 367 367 368 368 368 369 369 369 369 370 370 370 370 371 371 371 371 373 375 375 376 376 380 checksum: 11083 Diet 349 349 350 351 353 353 353 354 354 354 354 355 355 355 356 357 358 361 361 361 361 361 361 362 362 363 364 365 366 366 checksum: 10724 Find the five number summary (minimum. first quartile, median, third quartile, maximum) for cach soda. b. Make a combination histogram and boxplot for each type of soda. Include the live number summary. Scale the r-axis from 348 to 384 grams and use a bin width of 4 grams. c. Describe the center. shape. spread, and any outliers of each histogram. d. Compare the two samples. Each can is marked as containing 12 fluid ounces. 12 ounces is about 341 grams. Why is there so much variation from 341 grams in the samples
Step by Step Solution
There are 3 Steps involved in it
Lets go through each part of the problem step by step Part a FiveNumber Summary The fivenumber summary consists of the minimum first quartile Q1 median Q2 third quartile Q3 and maximum Regular Cola Mi... View full answer

Get step-by-step solutions from verified subject matter experts