Question: 27 Required information Financial Analysis: Procter & Gamble Part 1 of 3 The following questions are about key financials that impart useful insights into the
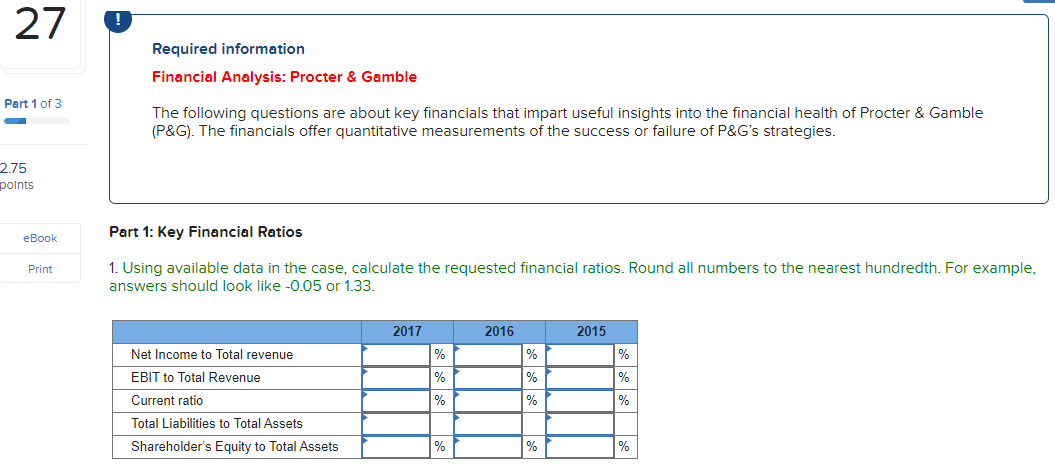
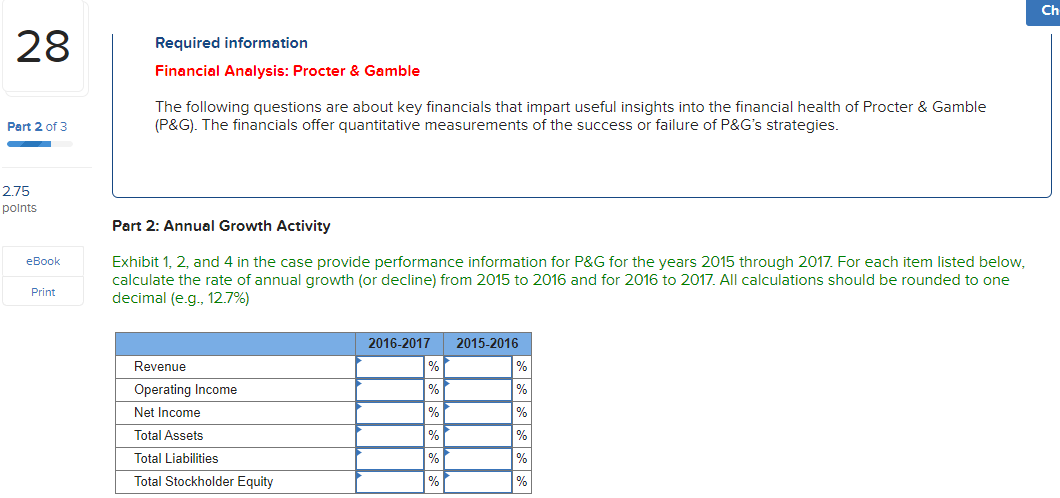
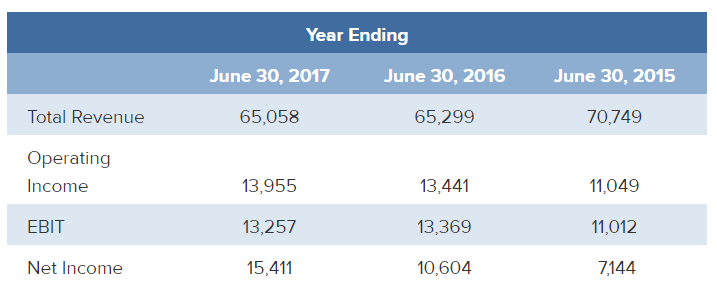
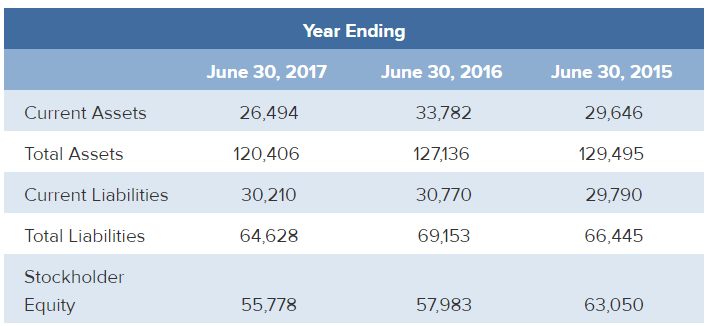
27 Required information Financial Analysis: Procter & Gamble Part 1 of 3 The following questions are about key financials that impart useful insights into the financial health of Procter & Gamble (P&G). The financials offer quantitative measurements of the success or failure of P&G's strategies. 2.75 points eBook Part 1: Key Financial Ratios Print 1. Using available data in the case, calculate the requested financial ratios. Round all numbers to the nearest hundredth. For example, answers should look like -0.05 or 1.33. 2017 2016 2015 % % % % Net Income to Total revenue EBIT to Total Revenue Current ratio Total Liabilities to Total Assets Shareholder's Equity to Total Assets % % % % % % % Ch 28 Required information Financial Analysis: Procter & Gamble The following questions are about key financials that impart useful insights into the financial health of Procter & Gamble (P&G). The financials offer quantitative measurements of the success or failure of P&G's strategies. Part 2 of 3 2.75 points Part 2: Annual Growth Activity eBook Exhibit 1, 2, and 4 in the case provide performance information for P&G for the years 2015 through 2017. For each item listed below, calculate the rate of annual growth (or decline) from 2015 to 2016 and for 2016 to 2017. All calculations should be rounded to one decimal (e.g., 12.7%) Print 2016-2017 2015-2016 % 0. % of Revenue Operating Income Net Income Total Assets Total Liabilities Total Stockholder Equity % % % Year Ending June 30, 2017 June 30, 2015 June 30, 2016 65,299 Total Revenue 65,058 70,749 Operating Income 13,955 13,441 11,049 EBIT 13,257 13,369 11,012 Net Income 15,411 10,604 7,144 Year Ending June 30, 2017 June 30, 2016 June 30, 2015 Current Assets 26,494 33,782 29,646 Total Assets 120,406 127,136 129,495 Current Liabilities 30,210 30,770 29,790 Total Liabilities 64,628 69,153 66,445 Stockholder Equity 55,778 57,983 63,050


