

Question: 27. See Table 2.5 showing financial statement data and stock price data for Mydeco Corp. a. How did Mydeco's book debt-equity ratio change from 2015
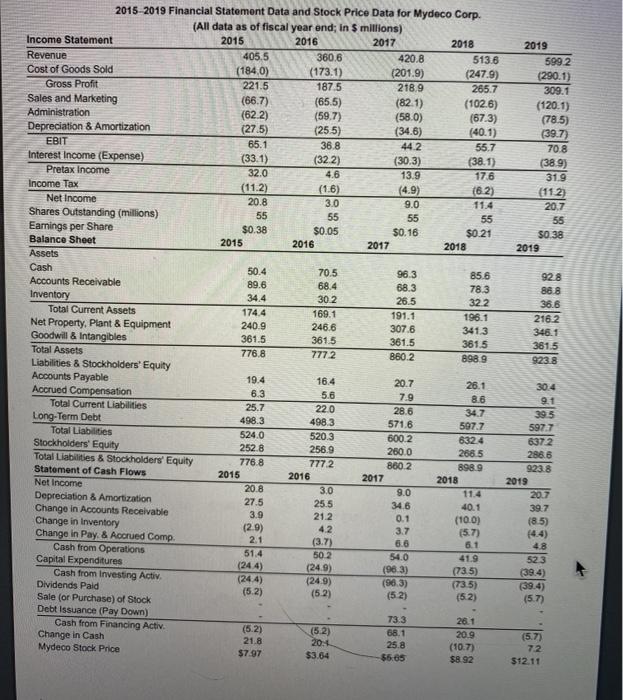
See Table 2.5 showing financial statement data and stock price data for Mydeco Corp. a. How did Mydeco's book debt-equity ratio change from 2015 to 2019? b. How did Mydeco's market debt-equity ratio change from 2015 to 2019? c. Compute Mydeco's debt-to-enterprise value ratio to assess how the fraction of its business that is debt financed has changed over the period. a. How did Mydeco's book debt-equity ratio change from 2015 to 2019? The book debt-equity ratio for 2015 is (Round to two decimal places.) 2019 5992 (290.1) 309.1 (120.1) (785) (39.7) 70.8 (38.9) 31.9 (112) 20.7 55 50.38 2019 11.4 2015-2019 Financial Statement Data and Stock Price Data for Mydeco Corp. (All data as of fiscal year end; in S millions) Income Statement 2015 2016 2017 2018 Revenue 405,5 360.6 420.8 5136 Cost of Goods Sold (1840) (173.1) (201.9) (247.9) Gross Profit 221.5 187.5 218.9 265.7 Sales and Marketing (66.7) (65.5) (82.1) (102.6) Administration (622) (59.7) (58.0) (67.3) Depreciation & Amortization (27.5) (255) (34.6) (40.1) EBIT 65.1 36.8 44.2 55.7 Interest Income (Expense) (33.1) (322) (30.3) (38.1) Pretax income 32.0 4.6 13.9 176 Income Tax (11.2) (1.6) (4.9) (82) Net Income 20.8 3.0 9.0 Shares Outstanding (millions) 55 55 55 55 Earnings per Share $0.38 $0.05 $0.16 $0.21 Balance Sheet 2015 2016 2017 2018 Assets Cash 50.4 70.5 96.3 85.6 Accounts Receivable 89.6 68.4 68.3 78.3 Inventory 34.4 302 26.5 322 Total Current Assets 174.4 169.1 191.1 196.1 Net Property, Plant & Equipment 240.9 246.6 307.6 341.3 Goodwill & Intangibles 361.5 361.5 361.5 361.5 Total Assets 776.8 7772 860.2 8989 Liabilities & Stockholders' Equity Accounts Payable 19.4 16.4 20.7 26.1 Accrued Compensation 6.3 5.6 7.9 8.6 Total Current Liabilities 25.7 22.0 28.6 34.7 Long-Term Debt 498.3 498.3 571.6 597.7 Total Liabilities 524.0 520.3 600.2 6324 Stockholders' Equity 252.8 256.9 250.0 268.5 Total Liabilities & Stockholders' Equity 776.8 7772 860.2 8989 Statement of Cash Flows 2015 2016 2017 2018 Net Income 20.8 3.0 9.0 Depreciation & Amortization 27.5 255 34.6 40.1 Change in Accounts Receivable 3.9 21.2 0.1 (10.0) Change in Inventory (2.9) 4.2 3.7 Change in Pay & Accrued Comp (5.7) (3.7) 6.6 6.1 Cash from Operations 51.4 50 2 Capital Expenditures 54.0 41.9 (244) (24.9) (963) (735) Cash from Investing Activ Dividends Paid (244) (249) (963) (735) (5.2) (5.2) Sale (or Purchase) of Stock (5.2) Debt Issuance (Pay Down) 73.3 26.1 Cash from Financing Activ (5.2) (5.2) 68.1 Change in Cash 20.9 21.8 20.1 25.8 (107) Mydeco Stock Price $7.97 $3.64 $5.05 $8.92 92.8 88.8 36.6 2162 346.1 361.5 923.8 30.4 9.1 395 597.7 6372 288.6 9238 2019 20.7 39.7 (85) 2.1 4.8 523 (39.4) (39.4) (5.73 (52) (5.7) 72 $12.11
Step by Step Solution
There are 3 Steps involved in it

Get step-by-step solutions from verified subject matter experts