

Question: 27. You are given the following data: Expected Annual Return 10% 35% Standard Deviation of Annual Return 25% Stock I Stock II 60% The correlation
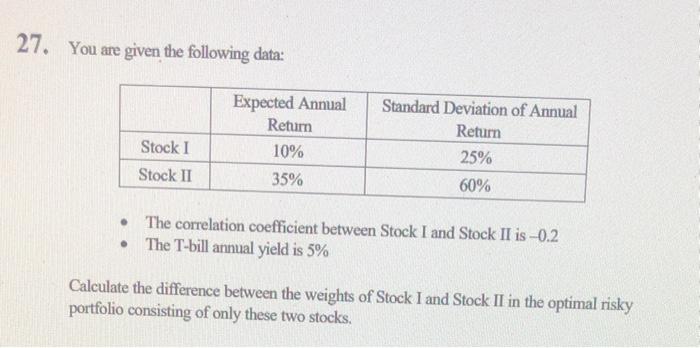
27. You are given the following data: Expected Annual Return 10% 35% Standard Deviation of Annual Return 25% Stock I Stock II 60% The correlation coefficient between Stock I and Stock II is -0.2 The T-bill annual yield is 5% . Calculate the difference between the weights of Stock I and Stock II in the optimal risky portfolio consisting of only these two stocks
Step by Step Solution
There are 3 Steps involved in it
1 Expert Approved Answer
Step: 1 Unlock

Question Has Been Solved by an Expert!
Get step-by-step solutions from verified subject matter experts
Step: 2 Unlock
Step: 3 Unlock