

Question: 2a. Using the template on the worksheet for question 2, create a table with the average infant mortality rate and poverty rate by region for
 2a. Using the template on the worksheet for question 2, create a table with the average infant mortality rate and poverty rate by region for the 50 counties in the State of Alexander. Label the table Alexander Statistics.
b. Create pie charts that answer this question: What percentage of HCS and PCI dollars go to each region of the state? Using the same data, create two column graphs showing the percentage distribution of HCS and PCI for each region of the state. Label each of the charts (HCS Pie Chart, HCS Column Chart, PCI Pie Chart, and PCI Column Chart).Which one of the charts best describes the data? Explain.
c. Create a pie chart and a bar chart using the average poverty rate variable by region data. Label the charts Poverty Pie Chart and Poverty Bar Chart respectively. Which one of the charts best describes the data?
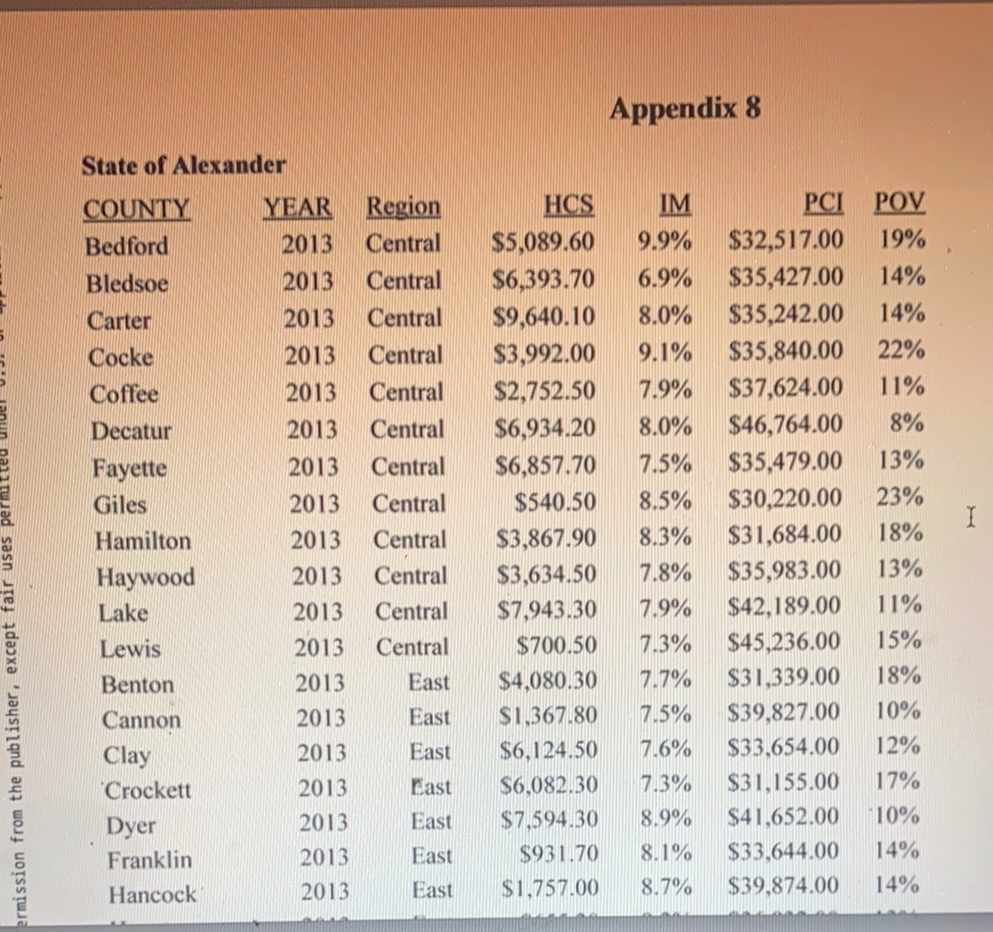
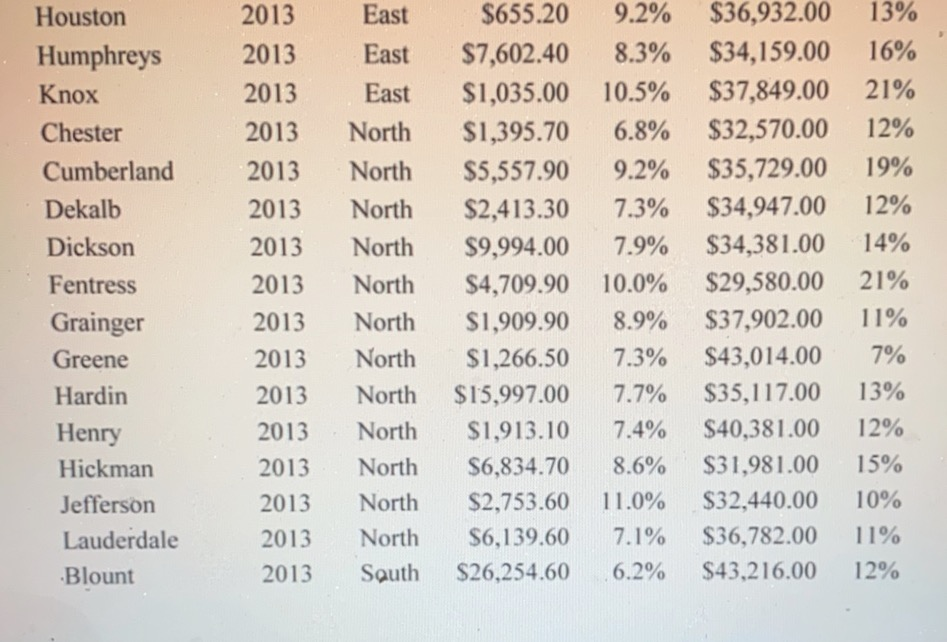
Appendix 8 State of Alexander HCS YEAR 2013 2013 2013 Region Central Central Central Central Central Central 2013 2013 2013 2013 2013 2013 I ermission from the publisher, except fair uses COUNTY Bedford Bledsoe Carter Cocke Coffee Decatur Fayette Giles Hamilton Haywood Lake Lewis Benton Cannon Clay Crockett Dyer Franklin Hancock $5,089.60 $6,393.70 $9,640.10 $3,992.00 $2,752.50 $6,934.20 $6,857.70 $540.50 $3,867.90 $3,634.50 $7,943.30 $700.50 $4.080.30 $1,367.80 $6,124.50 $6,082.30 $7,594.30 $931.70 $1,757.00 Central Central Central Central Central Central East East East Last East East IM 9.9% 6.9% 8.0% 9.1% 7.9% 8.0% 7.5% 8.5% 8.3% 7.8% 7.9% 7.3% 7.7% 7.5% 7.6% 7.3% 8.9% 8.1% 8.7% PCI $32,517.00 $35,427.00 $35,242.00 $35,840.00 $37,624.00 $46,764.00 $35,479.00 $30,220.00 $31,684.00 $35,983.00 $42,189.00 $45,236.00 $31,339.00 $39.827.00 $33,654.00 $31.155.00 $41.652.00 $33,644.00 $39,874.00 POV 19% 14% 14% 22% 11% 8% 13% 23% 18% 13% 11% 15% 18% 10% 12% 17% 10% 14% 14% 2013 2013 2013 2013 2013 2013 2013 2013 2013 2013 East East East East Houston Humphreys Knox Chester Cumberland Dekalb Dickson Fentress Grainger Greene Hardin Henry Hickman Jefferson Lauderdale Blount 2013 2013 2013 2013 2013 2013 2013 2013 2013 2013 13% 16% 21% 12% 19% 12% 14% 21% North North North North North North North North North North North North South $655.20 9.2% $7,602.40 8.3% $1,035.00 10.5% $1,395.70 6.8% $5,557.90 9.2% $2,413.30 7.3% $9,994.00 7.9% $4,709.90 10.0% $1,909.90 8.9% $1,266.50 7.3% $15,997.00 7.7% $1,913.10 7.4% $6,834.70 8.6% $2,753.60 11.0% $6,139.60 7.1% $26,254.60 6.2% $36,932.00 $34,159.00 $37,849.00 $32,570.00 $35,729.00 $34,947.00 $34,381.00 $29,580.00 $37,902.00 $43,014.00 $35,117.00 $40,381.00 $31.981.00 $32,440.00 $36,782.00 $43,216.00 2013 11% 7% 13% 12% 15% 10% 2013 2013 2013 2013 2013 11% 12% Appendix 8 State of Alexander HCS YEAR 2013 2013 2013 Region Central Central Central Central Central Central 2013 2013 2013 2013 2013 2013 I ermission from the publisher, except fair uses COUNTY Bedford Bledsoe Carter Cocke Coffee Decatur Fayette Giles Hamilton Haywood Lake Lewis Benton Cannon Clay Crockett Dyer Franklin Hancock $5,089.60 $6,393.70 $9,640.10 $3,992.00 $2,752.50 $6,934.20 $6,857.70 $540.50 $3,867.90 $3,634.50 $7,943.30 $700.50 $4.080.30 $1,367.80 $6,124.50 $6,082.30 $7,594.30 $931.70 $1,757.00 Central Central Central Central Central Central East East East Last East East IM 9.9% 6.9% 8.0% 9.1% 7.9% 8.0% 7.5% 8.5% 8.3% 7.8% 7.9% 7.3% 7.7% 7.5% 7.6% 7.3% 8.9% 8.1% 8.7% PCI $32,517.00 $35,427.00 $35,242.00 $35,840.00 $37,624.00 $46,764.00 $35,479.00 $30,220.00 $31,684.00 $35,983.00 $42,189.00 $45,236.00 $31,339.00 $39.827.00 $33,654.00 $31.155.00 $41.652.00 $33,644.00 $39,874.00 POV 19% 14% 14% 22% 11% 8% 13% 23% 18% 13% 11% 15% 18% 10% 12% 17% 10% 14% 14% 2013 2013 2013 2013 2013 2013 2013 2013 2013 2013 East East East East Houston Humphreys Knox Chester Cumberland Dekalb Dickson Fentress Grainger Greene Hardin Henry Hickman Jefferson Lauderdale Blount 2013 2013 2013 2013 2013 2013 2013 2013 2013 2013 13% 16% 21% 12% 19% 12% 14% 21% North North North North North North North North North North North North South $655.20 9.2% $7,602.40 8.3% $1,035.00 10.5% $1,395.70 6.8% $5,557.90 9.2% $2,413.30 7.3% $9,994.00 7.9% $4,709.90 10.0% $1,909.90 8.9% $1,266.50 7.3% $15,997.00 7.7% $1,913.10 7.4% $6,834.70 8.6% $2,753.60 11.0% $6,139.60 7.1% $26,254.60 6.2% $36,932.00 $34,159.00 $37,849.00 $32,570.00 $35,729.00 $34,947.00 $34,381.00 $29,580.00 $37,902.00 $43,014.00 $35,117.00 $40,381.00 $31.981.00 $32,440.00 $36,782.00 $43,216.00 2013 11% 7% 13% 12% 15% 10% 2013 2013 2013 2013 2013 11% 12%
Step by Step Solution
There are 3 Steps involved in it

Get step-by-step solutions from verified subject matter experts