

Question: ( 3 0 % ) Study the signal shown below. The signal is input into an RC circuit as V s ( t ) ,
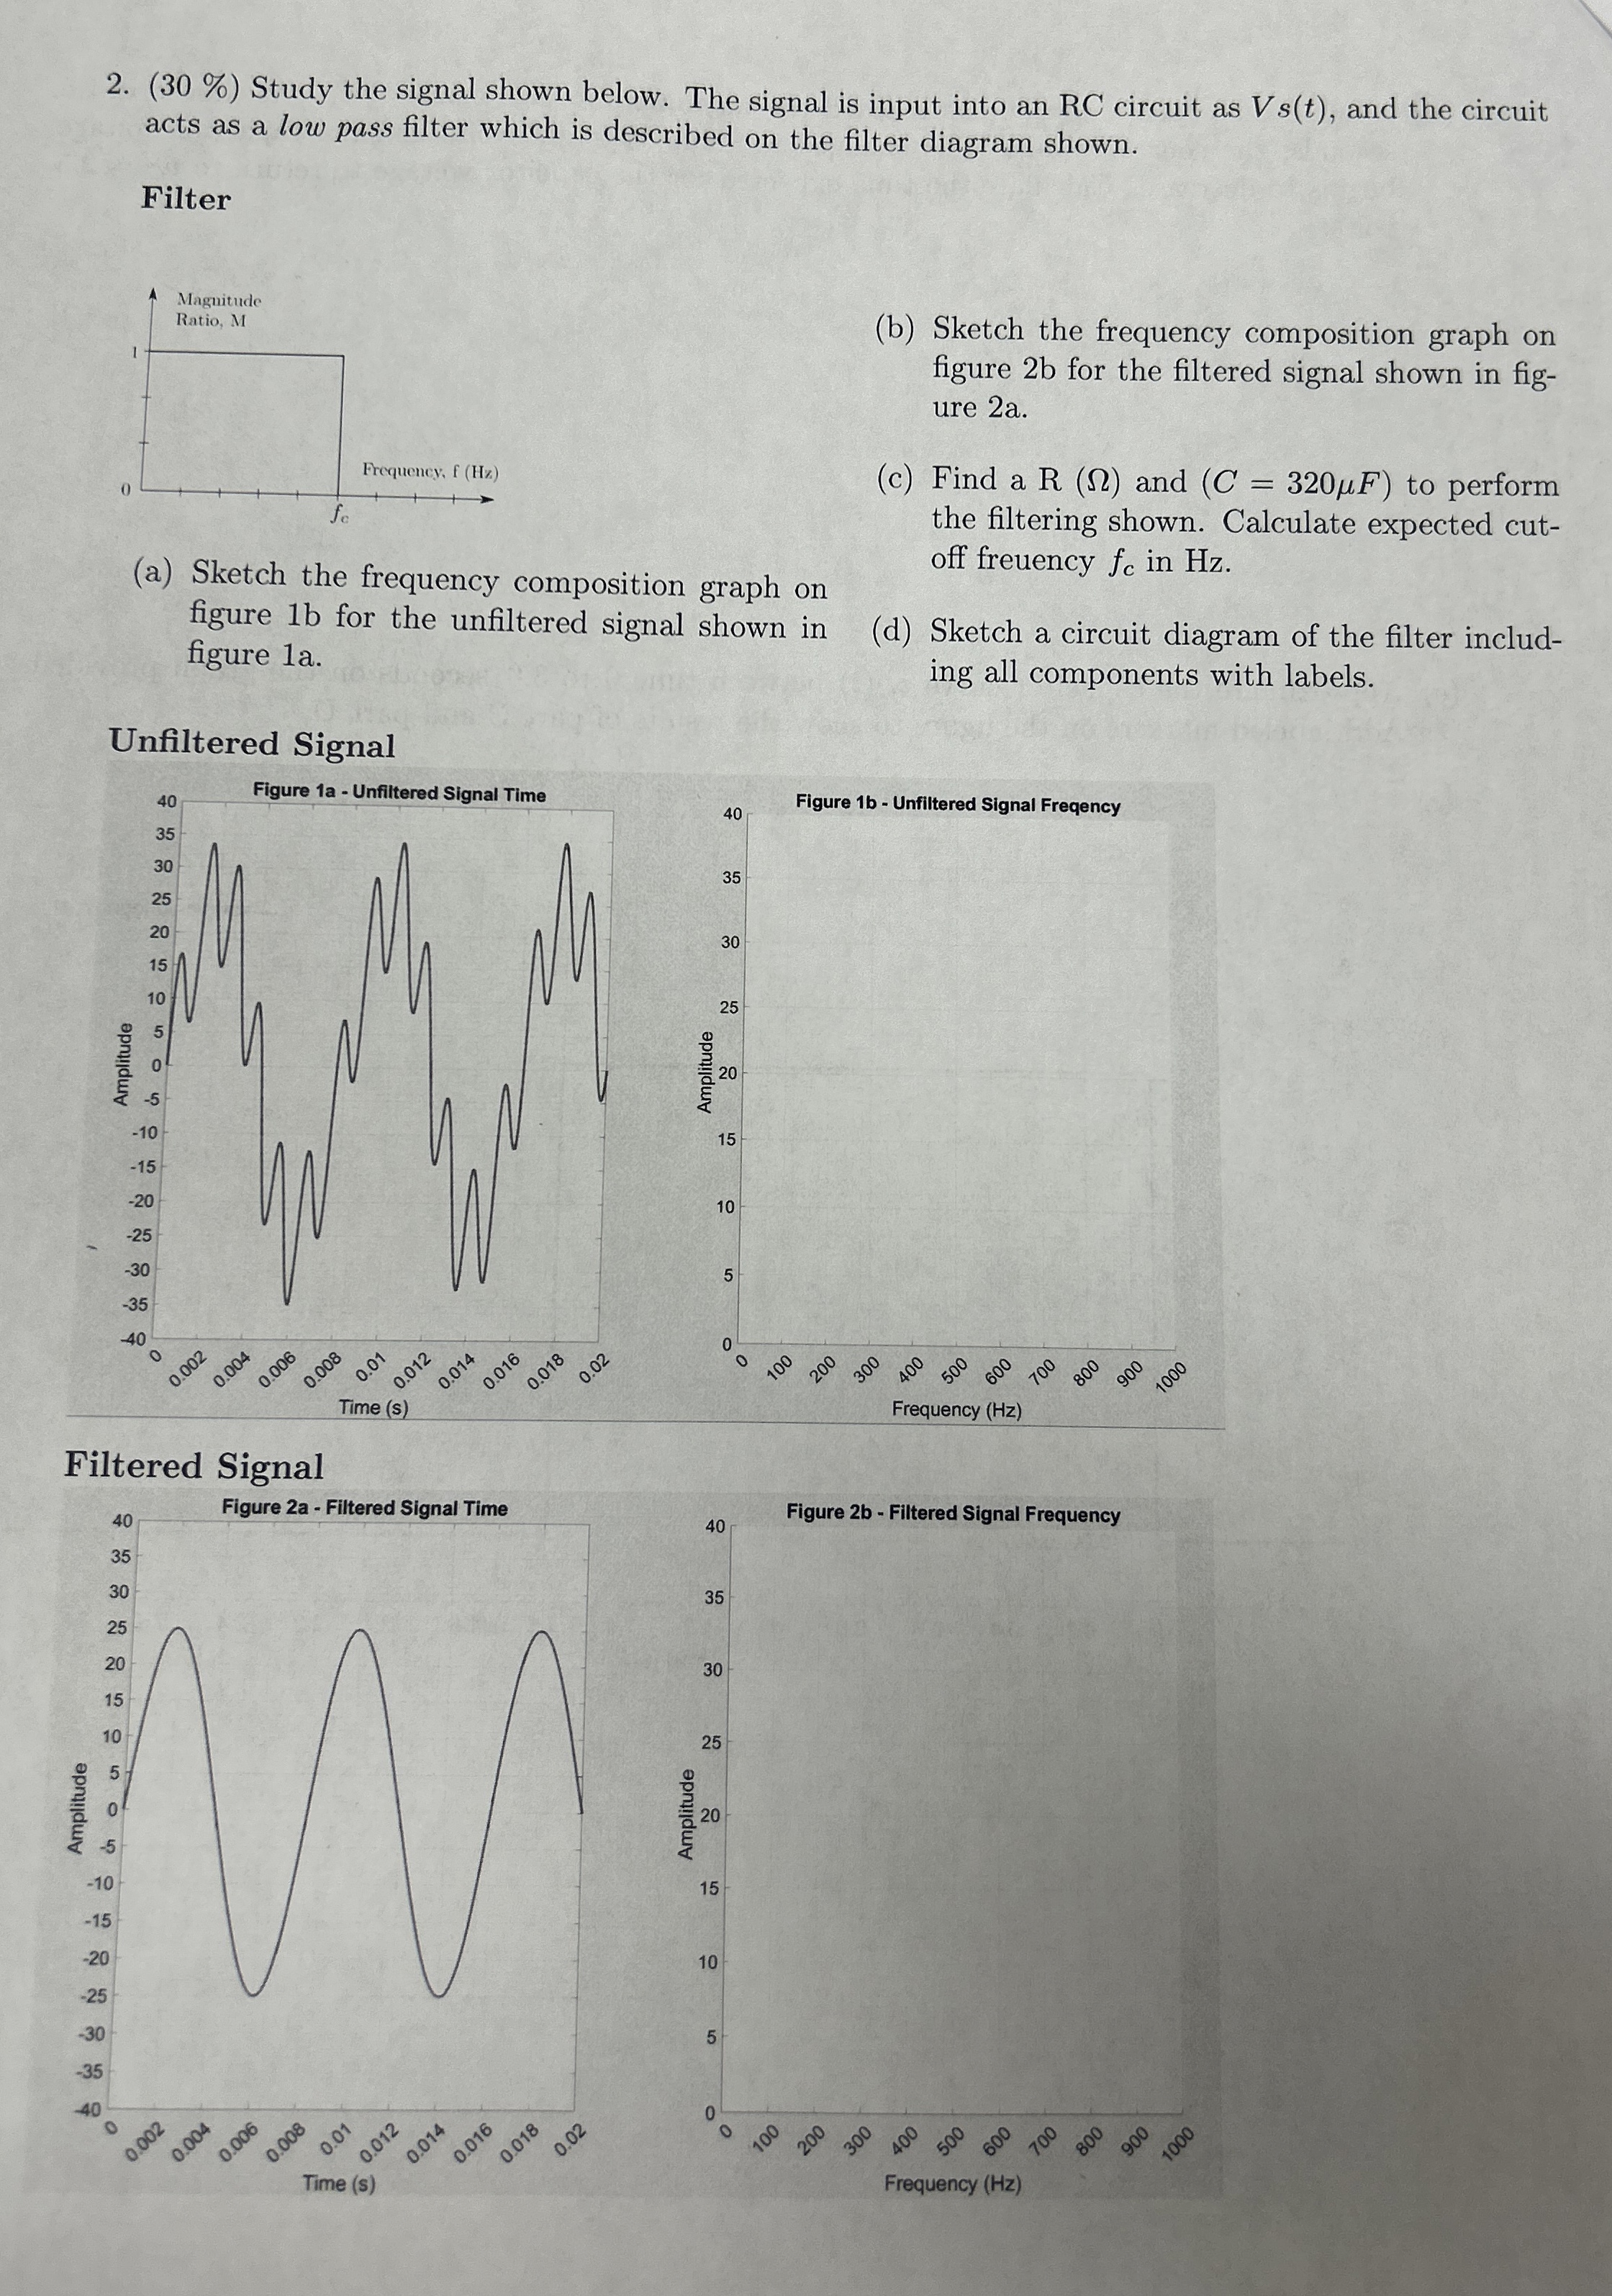
Study the signal shown below. The signal is input into an RC circuit as and the circuit acts as a low pass filter which is described on the filter diagram shown.
Filter
a Sketch the frequency composition graph on figure b for the unfiltered signal shown in figure a
b Sketch the frequency composition graph on figure for the filtered signal shown in figure a
c Find a and
Step by Step Solution
There are 3 Steps involved in it
1 Expert Approved Answer
Step: 1 Unlock

Question Has Been Solved by an Expert!
Get step-by-step solutions from verified subject matter experts
Step: 2 Unlock
Step: 3 Unlock