

Question: 3 . 1 An assembly line whose activities are shown in the table below has a demand of 4 5 units per day. The assembly
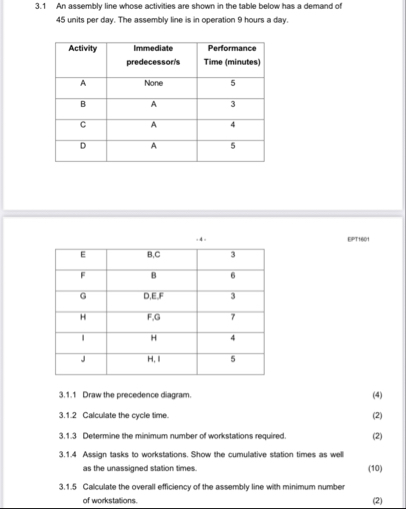
An assembly line whose activities are shown in the table below has a demand of units per day. The assembly line is in operation hours a day.
tableActivityImmediate predecessorsPerformance Time minutesANone,BACADA
EPTEEt
tableEBCFBDEFHFGIHJH I,
Draw the precedence diagram.
Calculate the cycle time.
Determine the minimum number of workstations required.
Assign tasks to workstations. Show the cumulative station times as well as the unassigned station times.
Calculate the overall efficiency of the assembly line with minimum number of workstations.
Step by Step Solution
There are 3 Steps involved in it
1 Expert Approved Answer
Step: 1 Unlock

Question Has Been Solved by an Expert!
Get step-by-step solutions from verified subject matter experts
Step: 2 Unlock
Step: 3 Unlock