

Question: 3. (1 point each) Match each process improvement tool in the left column with the most appropriate description or application in the right column. Do
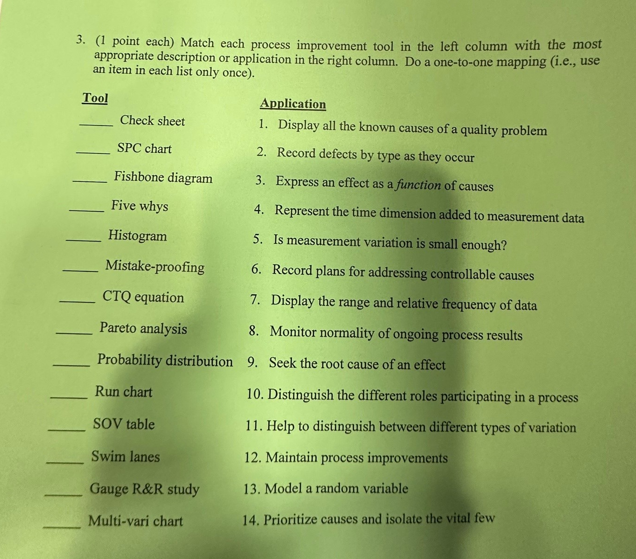
3. (1 point each) Match each process improvement tool in the left column with the most appropriate description or application in the right column. Do a one-to-one mapping (i.e., use an item in each list only once). Tool Application Check sheet 1. Display all the known causes of a quality problem SPC chart 2. Record defects by type as they occur Fishbone diagram 3. Express an effect as a function of causes Five whys 4. Represent the time dimension added to measurement data Histogram 5. Is measurement variation is small enough? Mistake-proofing 6. Record plans for addressing controllable causes CTQ equation 7. Display the range and relative frequency of data Pareto analysis 8. Monitor normality of ongoing process results Probability distribution 9. Seek the root cause of an effect Run chart 10. Distinguish the different roles participating in a process SOV table 1 1. Help to distinguish between different types of variation Swim lanes 12. Maintain process improvements Gauge R&R study 13. Model a random variable Multi-vari chart 14. Prioritize causes and isolate the vital few
Step by Step Solution
There are 3 Steps involved in it

Get step-by-step solutions from verified subject matter experts