

Question: 3 . 1 Pre - Lab Activities Consider the series RLC circuit illustrated in Figure 1 . Note that R L is not an actual
PreLab Activities
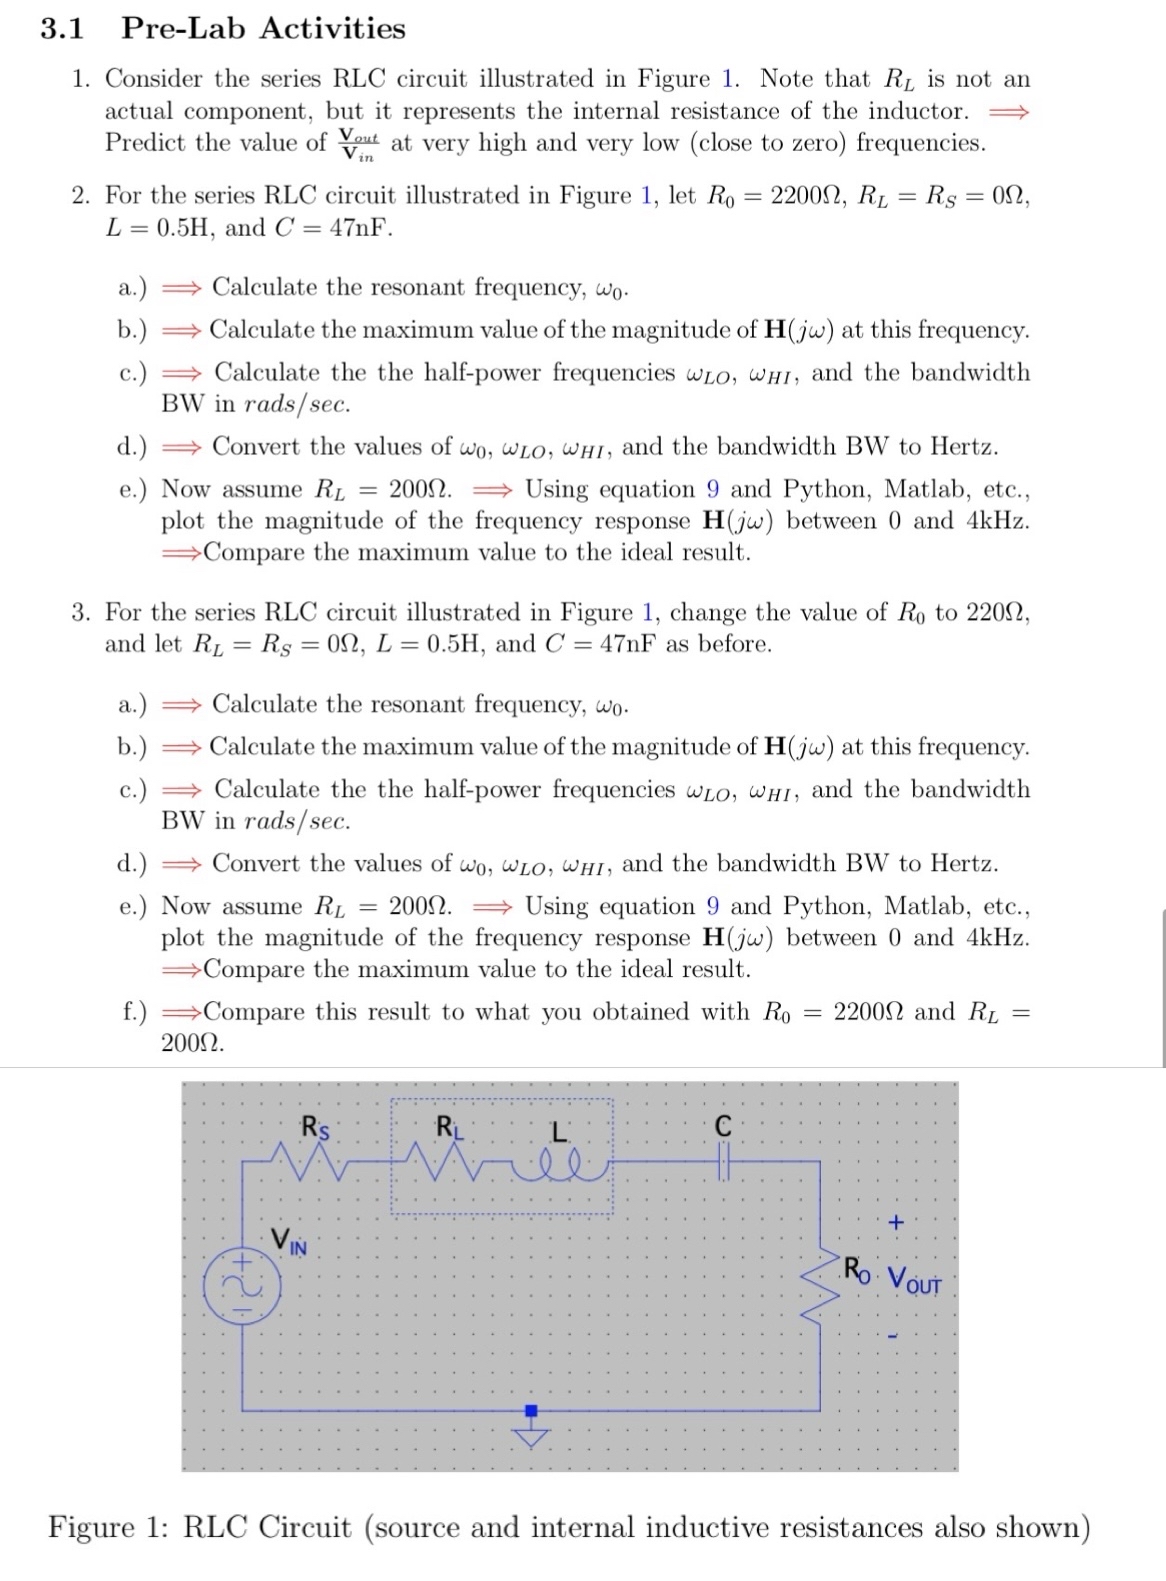
Consider the series RLC circuit illustrated in Figure Note that is not an actual component, but it represents the internal resistance of the inductor. Longrightarrow Predict the value of at very high and very low close to zero frequencies.
For the series RLC circuit illustrated in Figure let and
a Longrightarrow Calculate the resonant frequency,
b Longrightarrow Calculate the maximum value of the magnitude of at this frequency.
c Longrightarrow Calculate the the halfpower frequencies and the bandwidth BW in radssec
d Longrightarrow Convert the values of and the bandwidth BW to Hertz.
e Now assume Longrightarrow Using equation and Python, Matlab, etc., plot the magnitude of the frequency response between and kHz Longrightarrow Compare the maximum value to the ideal result.
For the series RLC circuit illustrated in Figure change the value of to and let and as before.
a Longrightarrow Calculate the resonant frequency,
b Longrightarrow Calculate the maximum value of the magnitude of at this frequency.
c Longrightarrow Calculate the the halfpower frequencies and the bandwidth BW in radssec
d Longrightarrow Convert the values of and the bandwidth BW to Hertz.
e Now assume Longrightarrow Using equation and Python, Matlab, etc., plot the magnitude of the frequency response between and kHz Longrightarrow Compare the maximum value to the ideal result.
f Longrightarrow Compare this result to what you obtained with and
Figure : RLC Circuit source and internal inductive resistances also shown
Step by Step Solution
There are 3 Steps involved in it
1 Expert Approved Answer
Step: 1 Unlock

Question Has Been Solved by an Expert!
Get step-by-step solutions from verified subject matter experts
Step: 2 Unlock
Step: 3 Unlock