

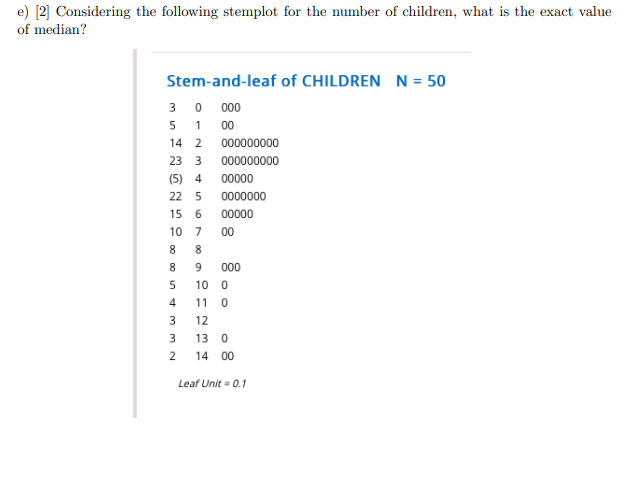
Question: 3. (11 points) Consider the histogram below for the number of children in a random sample of rural Canadian families. (Reference: American Journal Of Sociology,

![in 2 10 12 14 CHILDREN a) [4] Describe the distribution (shape,](https://s3.amazonaws.com/si.experts.images/answers/2024/06/6674e0339e6e8_6036674e0338dbe8.jpg)
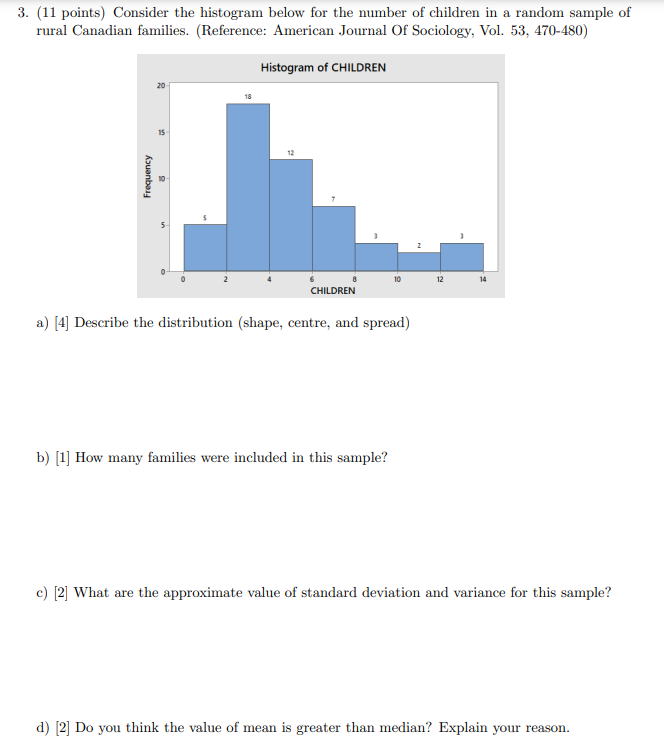
3. (11 points) Consider the histogram below for the number of children in a random sample of rural Canadian families. (Reference: American Journal Of Sociology, Vol. 53, 470-480) Histogram of CHILDREN 20 18 Frequency 10 in 2 10 12 14 CHILDREN a) [4] Describe the distribution (shape, centre, and spread) b) [1] How many families were included in this sample? c) [2] What are the approximate value of standard deviation and variance for this sample? d) [2] Do you think the value of mean is greater than median? Explain your reason.e) [2] Considering the following stemplot for the number of children, what is the exact value of median? Stem-and-leaf of CHILDREN N = 50 3 0 000 5 1 00 14 2 000000000 23 3 000000000 (5) 4 00000 22 5 0000000 15 6 00000 10 7 00 8 8 8 9 000 5 10 0 4 11 0 3 12 3 13 0 14 00 Leaf Unit = 0.1
Step by Step Solution
There are 3 Steps involved in it

Get step-by-step solutions from verified subject matter experts