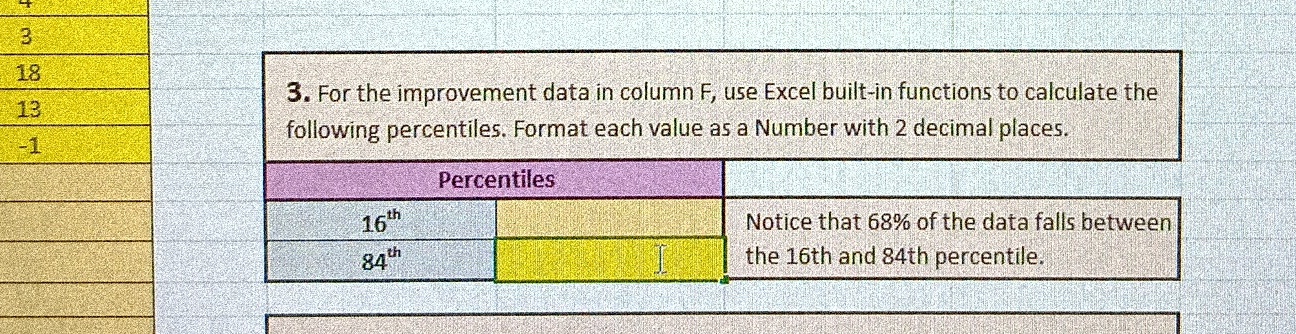
Question: 3 18 13 3. For the improvement data in column F, use Excel built-in functions to calculate the -1 following percentiles. Format each value as

3 18 13 3. For the improvement data in column F,
3 18 13 3. For the improvement data in column F, use Excel built-in functions to calculate the -1 following percentiles. Format each value as a Number with 2 decimal places. Percentiles 16 th Notice that 68% of the data falls between 84" the 16th and 84th percentile

Step by Step Solution

There are 3 Steps involved in it

1 Expert Approved Answer
Step: 1 Unlock blur-text-image
Question Has Been Solved by an Expert!

Get step-by-step solutions from verified subject matter experts

Step: 2 Unlock
Step: 3 Unlock

Students Have Also Explored These Related Accounting Questions!