

Question: 3.) (25) Using the data in the table below, draw the timeline for each of the following scheduling algorithms. Process Arrival Time Processing Time 0.000
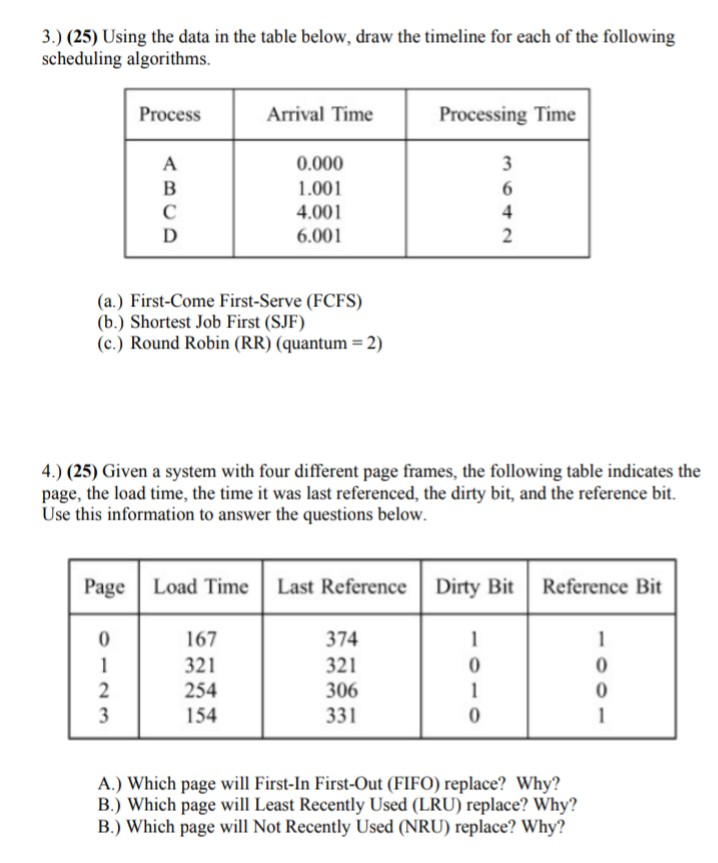
3.) (25) Using the data in the table below, draw the timeline for each of the following scheduling algorithms. Process Arrival Time Processing Time 0.000 1.001 4.001 6.001 (a.) First-Come First-Serve (FCFS) (b.) Shortest Job First (SJF) (c.) Round Robin (RR) (quantum 2) 4.) (25) Given a system with four different page frames, the following table indicates the page, the load time, the time it was last referenced, the dirty bit, and the reference bit. Use this information to answer the questions below Page Load Time Last Reference Dirty Bi Reference Bit 167 321 254 154 374 321 306 331 0 0 0 0 A.) Which page will First-In First-Out (FIFO) replace? Why? B.) Which page will Least Recently Used (LRU) replace? Why? B.) Which page will Not Recently Used (NRU) replace? Why
Step by Step Solution
There are 3 Steps involved in it

Get step-by-step solutions from verified subject matter experts