

Question: 3. (3 pts.) The spreadsheet Homework 3 Data in the tab Q3 data' has monthly returns from 2005 2014 for ten large stocks, and
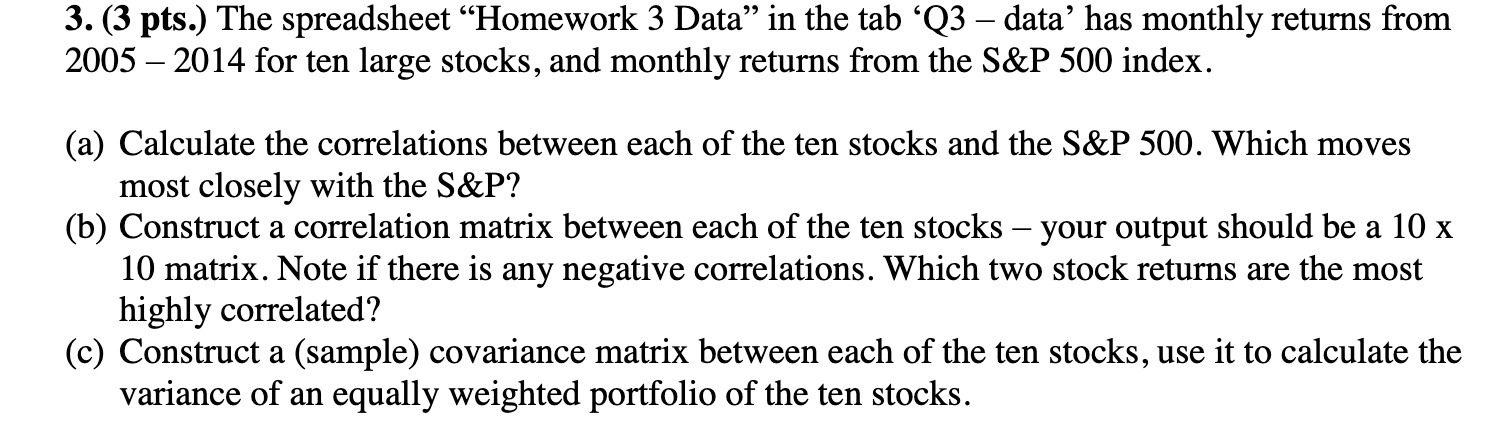
3. (3 pts.) The spreadsheet "Homework 3 Data in the tab Q3 data' has monthly returns from 2005 2014 for ten large stocks, and monthly returns from the S&P 500 index. (a) Calculate the correlations between each of the ten stocks and the S&P 500. Which moves most closely with the S&P? - (b) Construct a correlation matrix between each of the ten stocks your output should be a 10 x 10 matrix. Note if there is any negative correlations. Which two stock returns are the most highly correlated? (c) Construct a (sample) covariance matrix between each of the ten stocks, use it to calculate the variance of an equally weighted portfolio of the ten stocks.
Step by Step Solution
There are 3 Steps involved in it

Get step-by-step solutions from verified subject matter experts