

Question: 3 . ( a ) Define a resonance ( 2 ) ( b ) Figure 2 shows power resonance curves ( A and B )
a Define a resonance
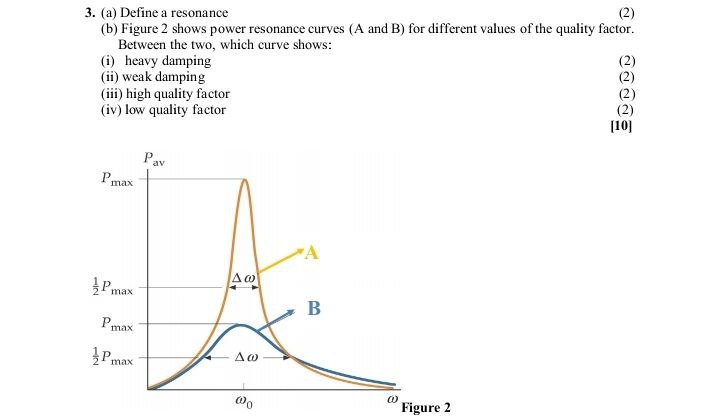
b Figure shows power resonance curves A and B for different values of the quality factor. Between the two, which curve shows:
i heavy damping
ii weak damping
iii high quality factor
iv low quality factor
Step by Step Solution
There are 3 Steps involved in it
1 Expert Approved Answer
Step: 1 Unlock

Question Has Been Solved by an Expert!
Get step-by-step solutions from verified subject matter experts
Step: 2 Unlock
Step: 3 Unlock