

Question: 3. (a) FIGURE Q3 schematically presents the process of diffusion in a semi-infinite medium, with the fractional concentration change (6) defined by Equation Q3.1. FIGURE
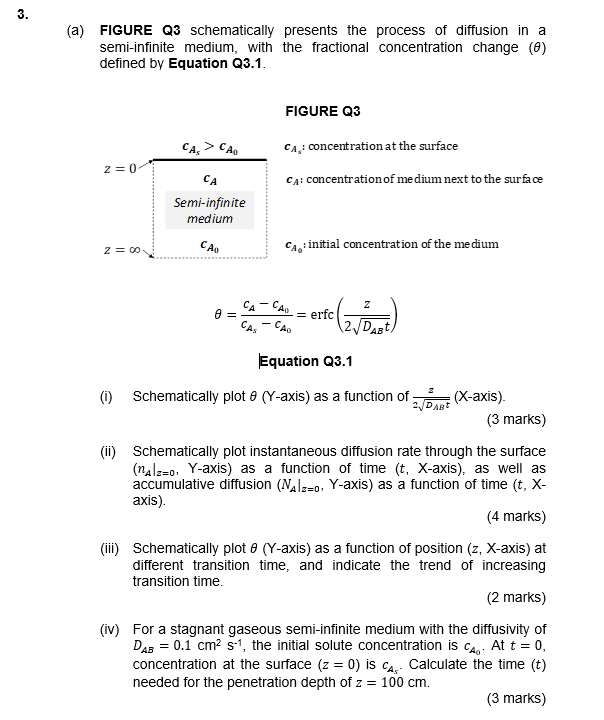
3. (a) FIGURE Q3 schematically presents the process of diffusion in a semi-infinite medium, with the fractional concentration change (6) defined by Equation Q3.1. FIGURE Q3 > Ag CA: concentration at the surface 2=0 CA: concentration of medium next to the surface CA Semi-infinite medium Z=00 CAO CA, initial concentration of the medium Z CACAO o= CAS = erfc -Cao 2. DABE Equation Q3.1 (1) Schematically plot 8 (Y-axis) as a function of (X-axis). (3 marks) (ii) Schematically plot instantaneous diffusion rate through the surface (nalz=o. Y-axis) as a function of time (t, X-axis), as well as accumulative diffusion (NA12=0, Y-axis) as a function of time (t, X- axis) (4 marks) (ii) Schematically plot 8 (Y-axis) as a function of position (2, X-axis) at different transition time, and indicate the trend of increasing transition time. (2 marks) (iv) For a stagnant gaseous semi-infinite medium with the diffusivity of DAB = 0.1 cm2 5-1, the initial solute concentration is CA,. At t = 0, concentration at the surface (z = 0) is CA - Calculate the time (t) needed for the penetration depth of z = 100 cm
Step by Step Solution
There are 3 Steps involved in it

Get step-by-step solutions from verified subject matter experts