

Question: 3. A teacher surveyed her class. The dotplot shows the ages of all part-time and full-time students who receive financial aid. Part Time 8 Full
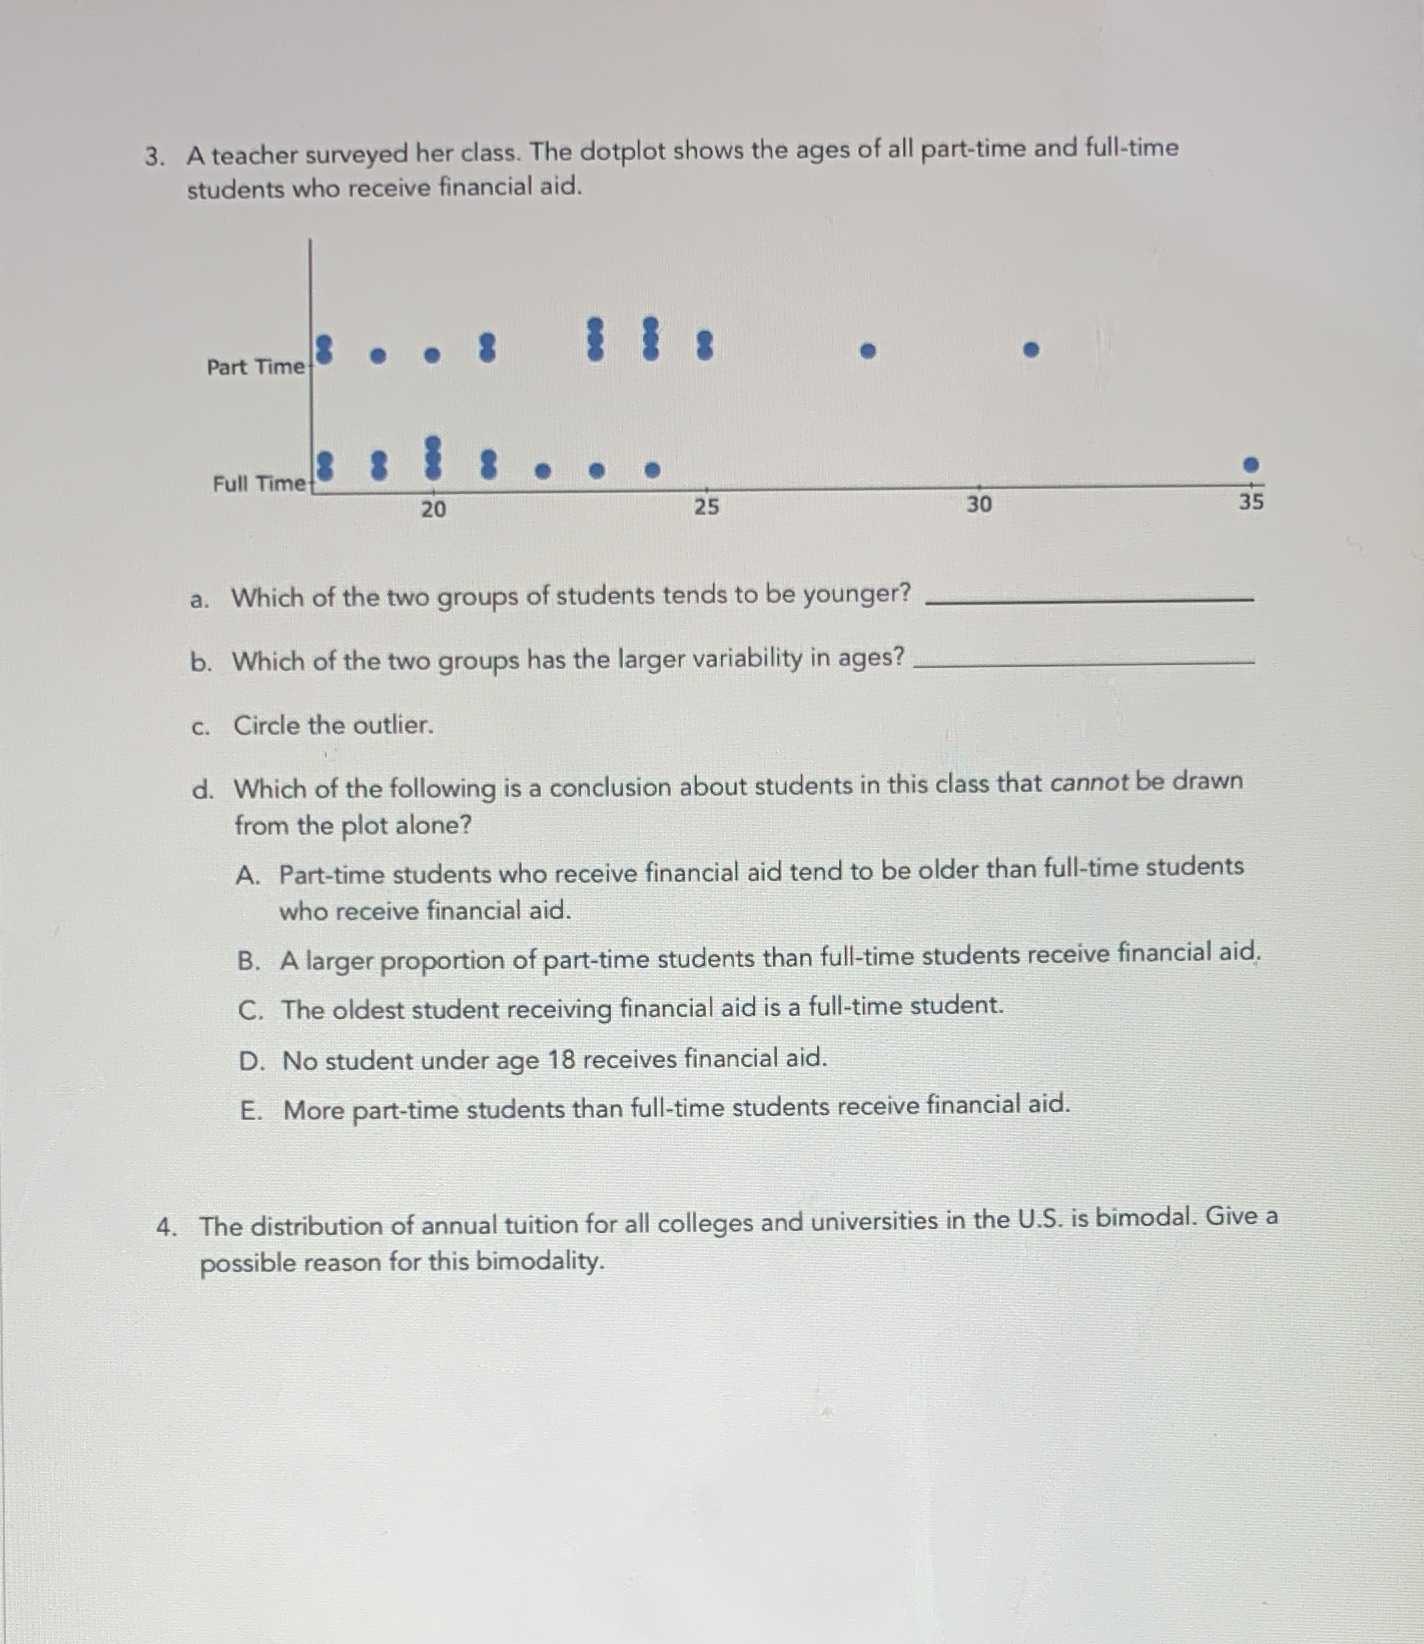
3. A teacher surveyed her class. The dotplot shows the ages of all part-time and full-time students who receive financial aid. Part Time 8 Full Time 20 25 30 a. Which of the two groups of students tends to be younger? b. Which of the two groups has the larger variability in ages? c. Circle the outlier. d. Which of the following is a conclusion about students in this class that cannot be drawn from the plot alone? A. Part-time students who receive financial aid tend to be older than full-time students who receive financial aid. B. A larger proportion of part-time students than full-time students receive financial aid, C. The oldest student receiving financial aid is a full-time student. D. No student under age 18 receives financial aid. E. More part-time students than full-time students receive financial aid. 4. The distribution of annual tuition for all colleges and universities in the U.S. is bimodal. Give a possible reason for this bimodality
Step by Step Solution
There are 3 Steps involved in it

Get step-by-step solutions from verified subject matter experts