

Question: 3. Analyze and interpret the data presented in Table 1. Table 1.Quality of Service and Facilities Rendered at Treasures of Leisure Coast Resort. N=40 Sustainable
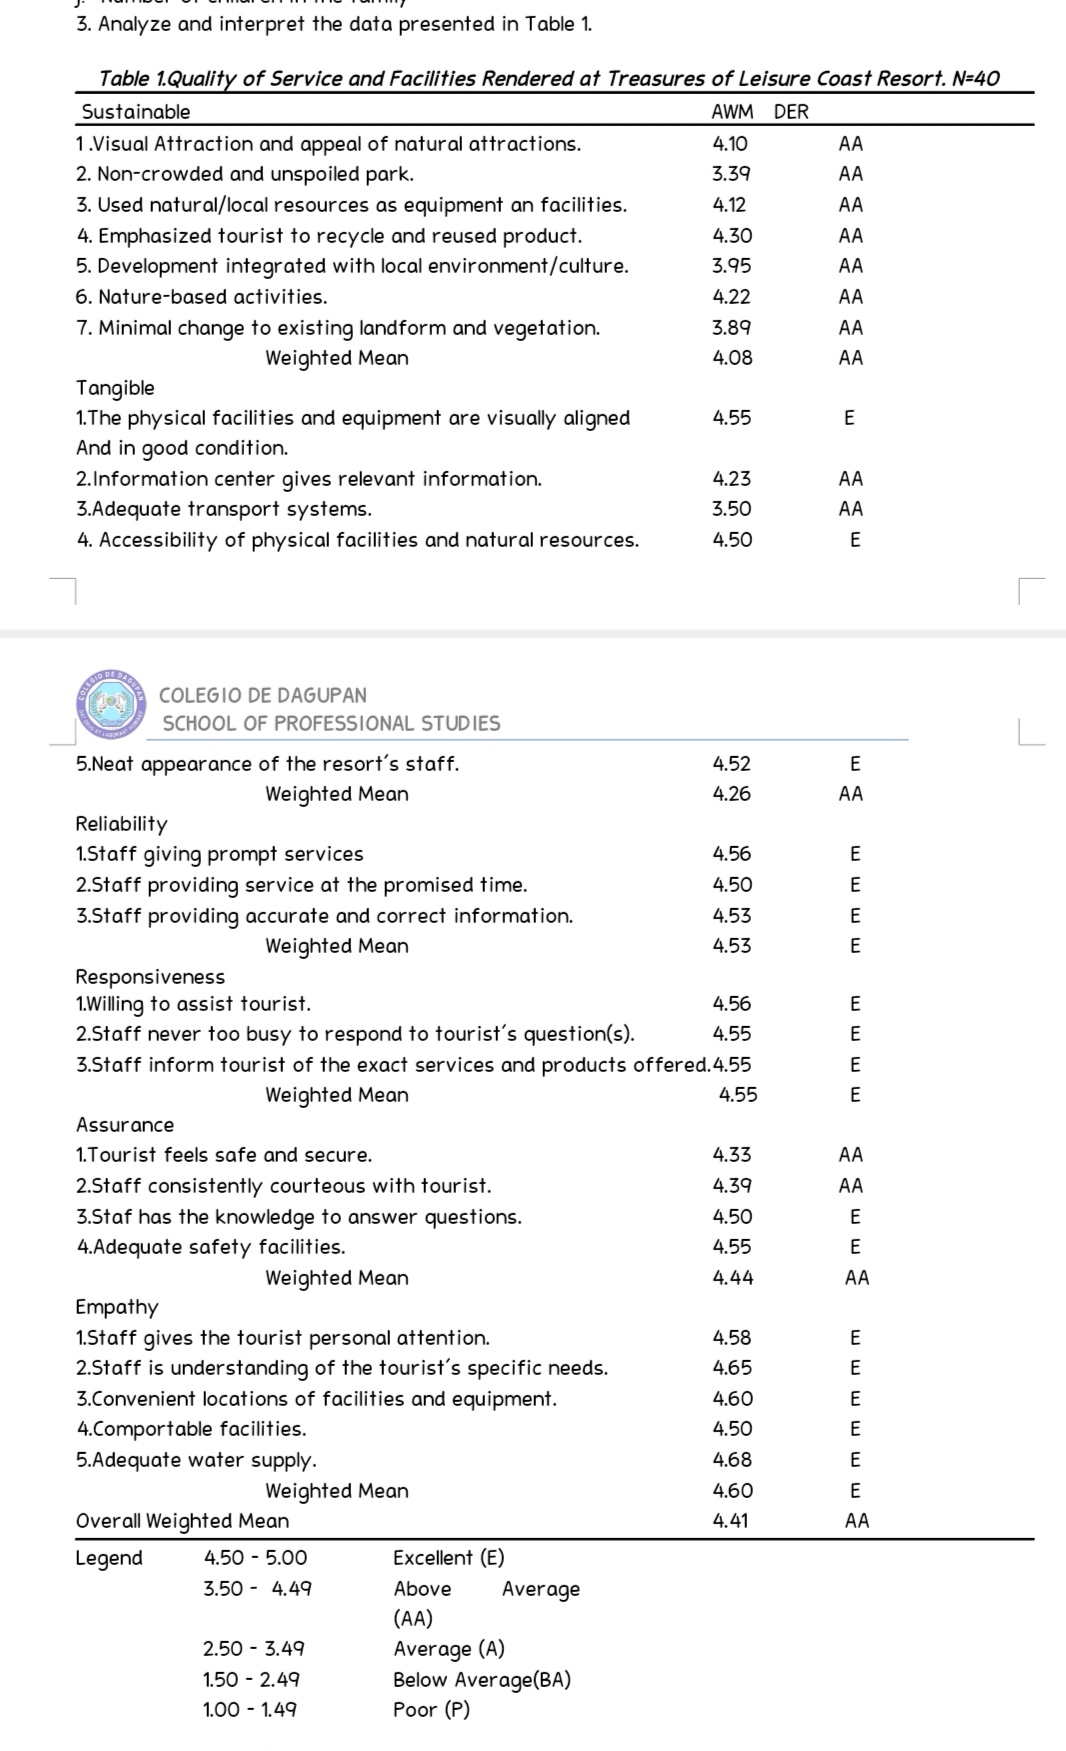
3. Analyze and interpret the data presented in Table 1. Table 1.Quality of Service and Facilities Rendered at Treasures of Leisure Coast Resort. N=40 Sustainable AWM DER 1. Visual Attraction and appeal of natural attractions. 4.10 AA 2. Non-crowded and unspoiled park. 3.39 AA 3. Used natural/local resources as equipment an facilities. 4.12 AA 4. Emphasized tourist to recycle and reused product. 4.30 AA 5. Development integrated with local environment/culture. 3.95 AA 6. Nature-based activities. 4.22 AA 7. Minimal change to existing landform and vegetation. 3.89 AA Weighted Mean 4.08 AA Tangible 1. The physical facilities and equipment are visually aligned 4.55 E And in good condition. 2.Information center gives relevant information. 4.23 AA 3.Adequate transport systems. 3.50 AA 4. Accessibility of physical facilities and natural resources. 4.50 E COLEGIO DE DAGUPAN SCHOOL OF PROFESSIONAL STUDIES L 5.Neat appearance of the resort's staff. 4.52 Weighted Mean 4.26 AA Reliability 1.Staff giving prompt services 4.56 2.Staff providing service at the promised time. 4.50 mm mm 3.Staff providing accurate and correct information. 4.53 Weighted Mean 4.53 Responsiveness 1.Willing to assist tourist. 4.56 2.Staff never too busy to respond to tourist's question(s). 4.55 mm mm 3.Staff inform tourist of the exact services and products offered. 4.55 Weighted Mean 4.55 Assurance 1.Tourist feels safe and secure. 4.33 AA 2.Staff consistently courteous with tourist. 4.39 AA 3.Staf has the knowledge to answer questions. 4.50 E 4.Adequate safety facilities. 4.55 F Weighted Mean 4.44 AA Empathy 1.Staff gives the tourist personal attention. 4.58 2.Staff is understanding of the tourist's specific needs. 4.65 3.Convenient locations of facilities and equipment. 4.60 mmm mmm 4. Comportable facilities. 4.50 5.Adequate water supply. 4.68 Weighted Mean 4.60 Overall Weighted Mean 4.41 AA Legend 4.50 - 5.00 Excellent (E) 3.50 - 4.49 Above Average (AA) 2.50 - 3.49 Average (A) 1.50 - 2.49 Below Average(BA) 1.00 - 1.49 Poor (P)
Step by Step Solution
There are 3 Steps involved in it

Get step-by-step solutions from verified subject matter experts