

Question: #3 and #4 in the data graph bottom half 2. Ella invests $2,000 in an account that pays 4% annual interest rate, compounded continuously. What
#3 and #4 in the data graph bottom half
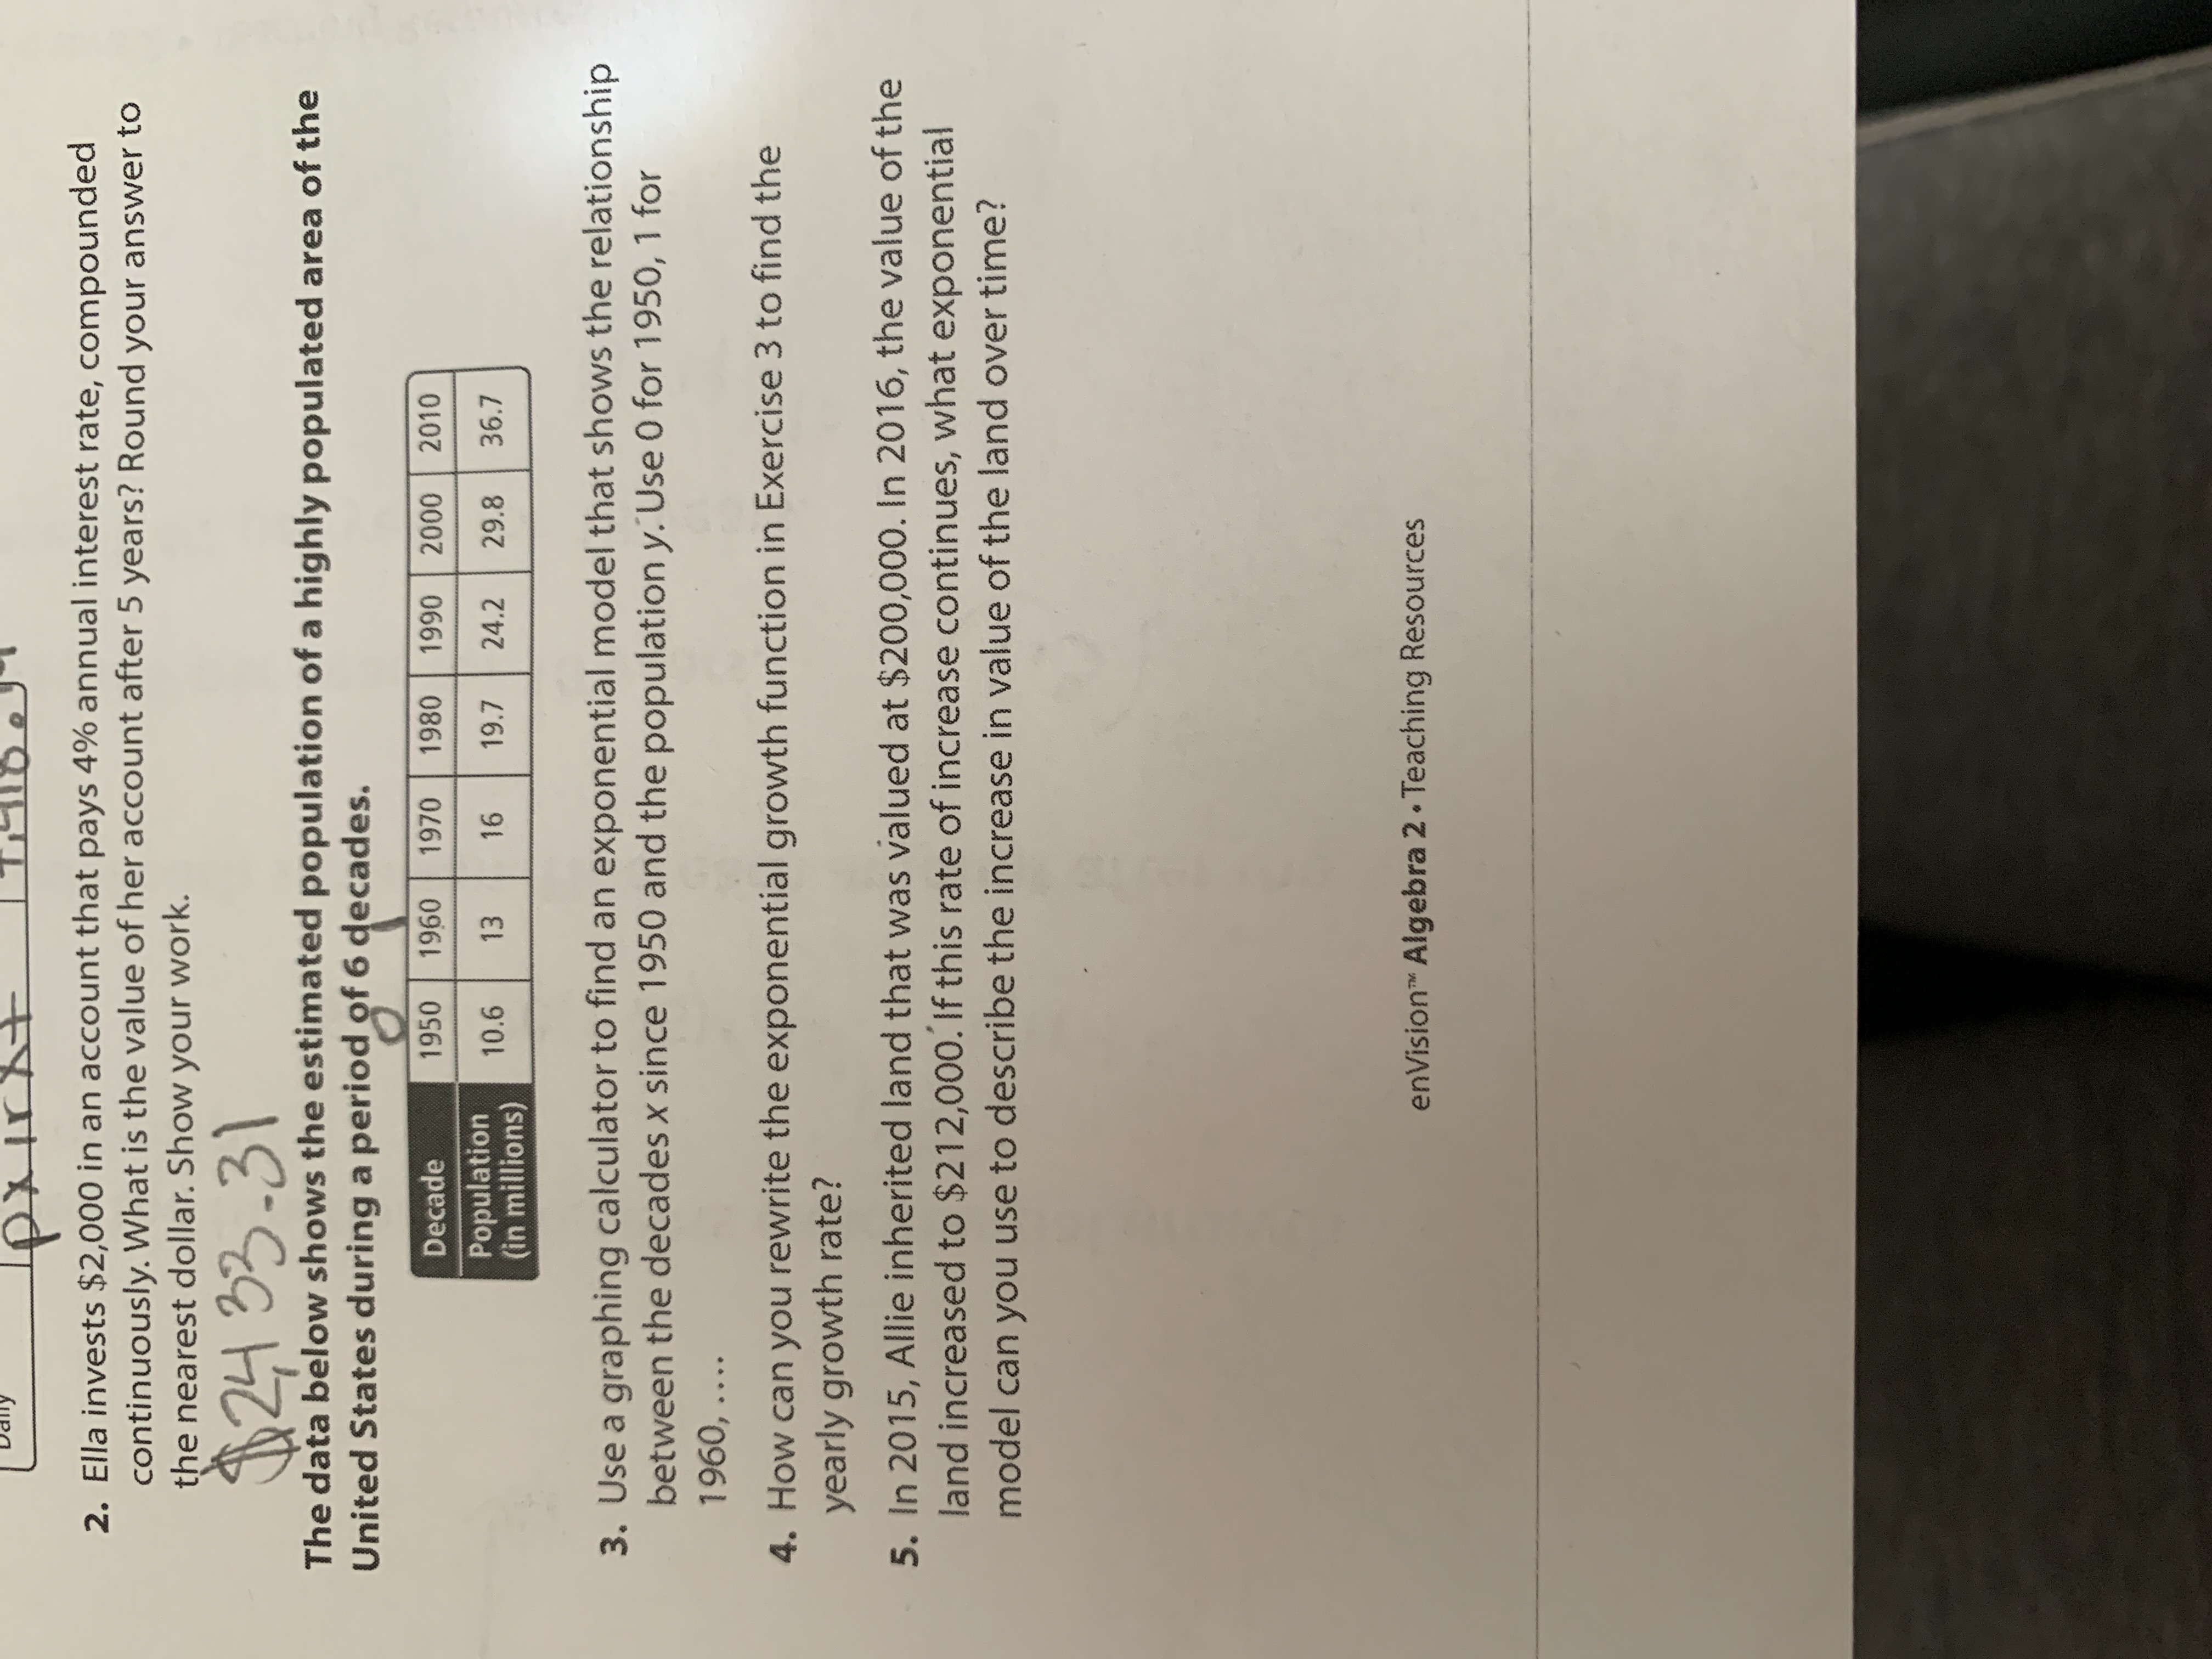
2. Ella invests $2,000 in an account that pays 4% annual interest rate, compounded continuously. What is the value of her account after 5 years? Round your answer to the nearest dollar. Show your work. $ 24 33- 31 The data below shows the estimated population of a highly populated area of the United States during a period of 6 decades. Decade 1950 1960 1970 1980 1990 2000 2010 Population (in millions) 10.6 13 16 19.7 24.2 29.8 36.7 3. Use a graphing calculator to find an exponential model that shows the relationship between the decades x since 1950 and the population y. Use 0 for 1950, 1 for 1960, .... 4. How can you rewrite the exponential growth function in Exercise 3 to find the yearly growth rate? 5. In 2015, Allie inherited land that was valued at $200,000. In 2016, the value of the land increased to $212,000. If this rate of increase continues, what exponential model can you use to describe the increase in value of the land over time? enVision Algebra 2 . Teaching Resources
Step by Step Solution
There are 3 Steps involved in it

Get step-by-step solutions from verified subject matter experts