

Question: 3. Average ofthe so samples 4 Standard Deviation of the 50 samples Add a single Bokand Whisker plot showing : plants before the change 6.
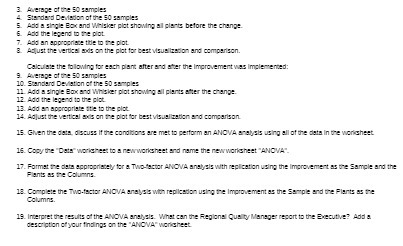
3. Average ofthe so samples 4 Standard Deviation of the 50 samples Add a single Bokand Whisker plot showing : plants before the change 6. Add the legend bie pot 7. Ad on appropriate the to the plot B. Adjust the vertical ads on the plot for best visup codon and comparison. Calculate the following for such plant after and over the Improvement was Implemented: 9. Average of the 50 samples 10. Standard Deviation of the 50 samples 11 Add a single Box and Whisker plot showing all plants onder the change 12 Add the legend to the plot. 13. Add an appropriate title to the plot. 14. Adjust the vertical ads on the plot for best visuw sutton and comparison. 15. Given the duto, discuss If the conditions are met to perform on ANOVA analysis using all of the data In the worksheet. 16. Copy the "Duis"worldheat to A new worksheet and num: the newworksheet "ANOVAY 17. Format the doto appropriately for a Two-actor ANOVA angels with replication using the Improvement as the Sample and the Plants as the Columns 18. Complete the Two-facton ANOVA graysis with replicadon using the Improvement as the Sample and the Planis is the Columns. 18. Interpret the results of the ANOVA anghels. What can the Regional Quality Manager report to the Executive? Add a description of your findings on the "ANOVA" worksheet
Step by Step Solution
There are 3 Steps involved in it

Get step-by-step solutions from verified subject matter experts